- Ethereum price shows a top formation around $1,350 hurdle and could trigger a market reversal.
- If sellers band together, ETH could slide 13% to retest the first target at $1,150 and nearly 20% to tag the second target at $1,071.
- A four-hour candlestick close that flips the $1,375 resistance barrier into a support level will invalidate the bearish thesis.
Ethereum price action over the last few hours has produced two local tops, which could catalyze a shift in trend, favoring bears. Interestingly, this move resembled a similar local top formed in mid-December that led to a steep correction.
Also Read: Bitcoin price might crash violently ahead of US CPI release, dragging altcoins with it
Ethereum price at make-or-break point
Ethereum price has rallied 16% in the last three weeks with no signs of stopping. As the smart contract token approaches the $1,375 hurdle, investors need to rethink their outlook on ETH due to three reasons.
- Ethereum price has formed two local tops at $1,375, making it a resistance level that needs to be watched carefully as it could result in another sell-off.
- The Relative Strength Index (RSI) is in the overbought reason, indicating that a trend reversal is likely.
- Lastly, Bitcoin price has clearly suggested a local top formation, which will lead to a quick correction that could extend as low as $15,443.
Let’s discuss the first two points.
Ethereum price is currently hovering inside the range, extending from $1,679 to $1,071, which was formed after a 36% crash in early November 2022. In addition to $1,375 being a formidable resistance level, the midpoint of the aforementioned range coincides here, making it a tough level to overcome.
Furthermore, the RSI has produced a bearish divergence, indicating that the sellers are likely to takeover. A bearish divergence occurs when the price of an asset is trending upwards but an indicator such as the RSI is trending downwards, suggesting a potential reversal of the current uptrend.Therefore, investors need to exercise caution when trading ETH.
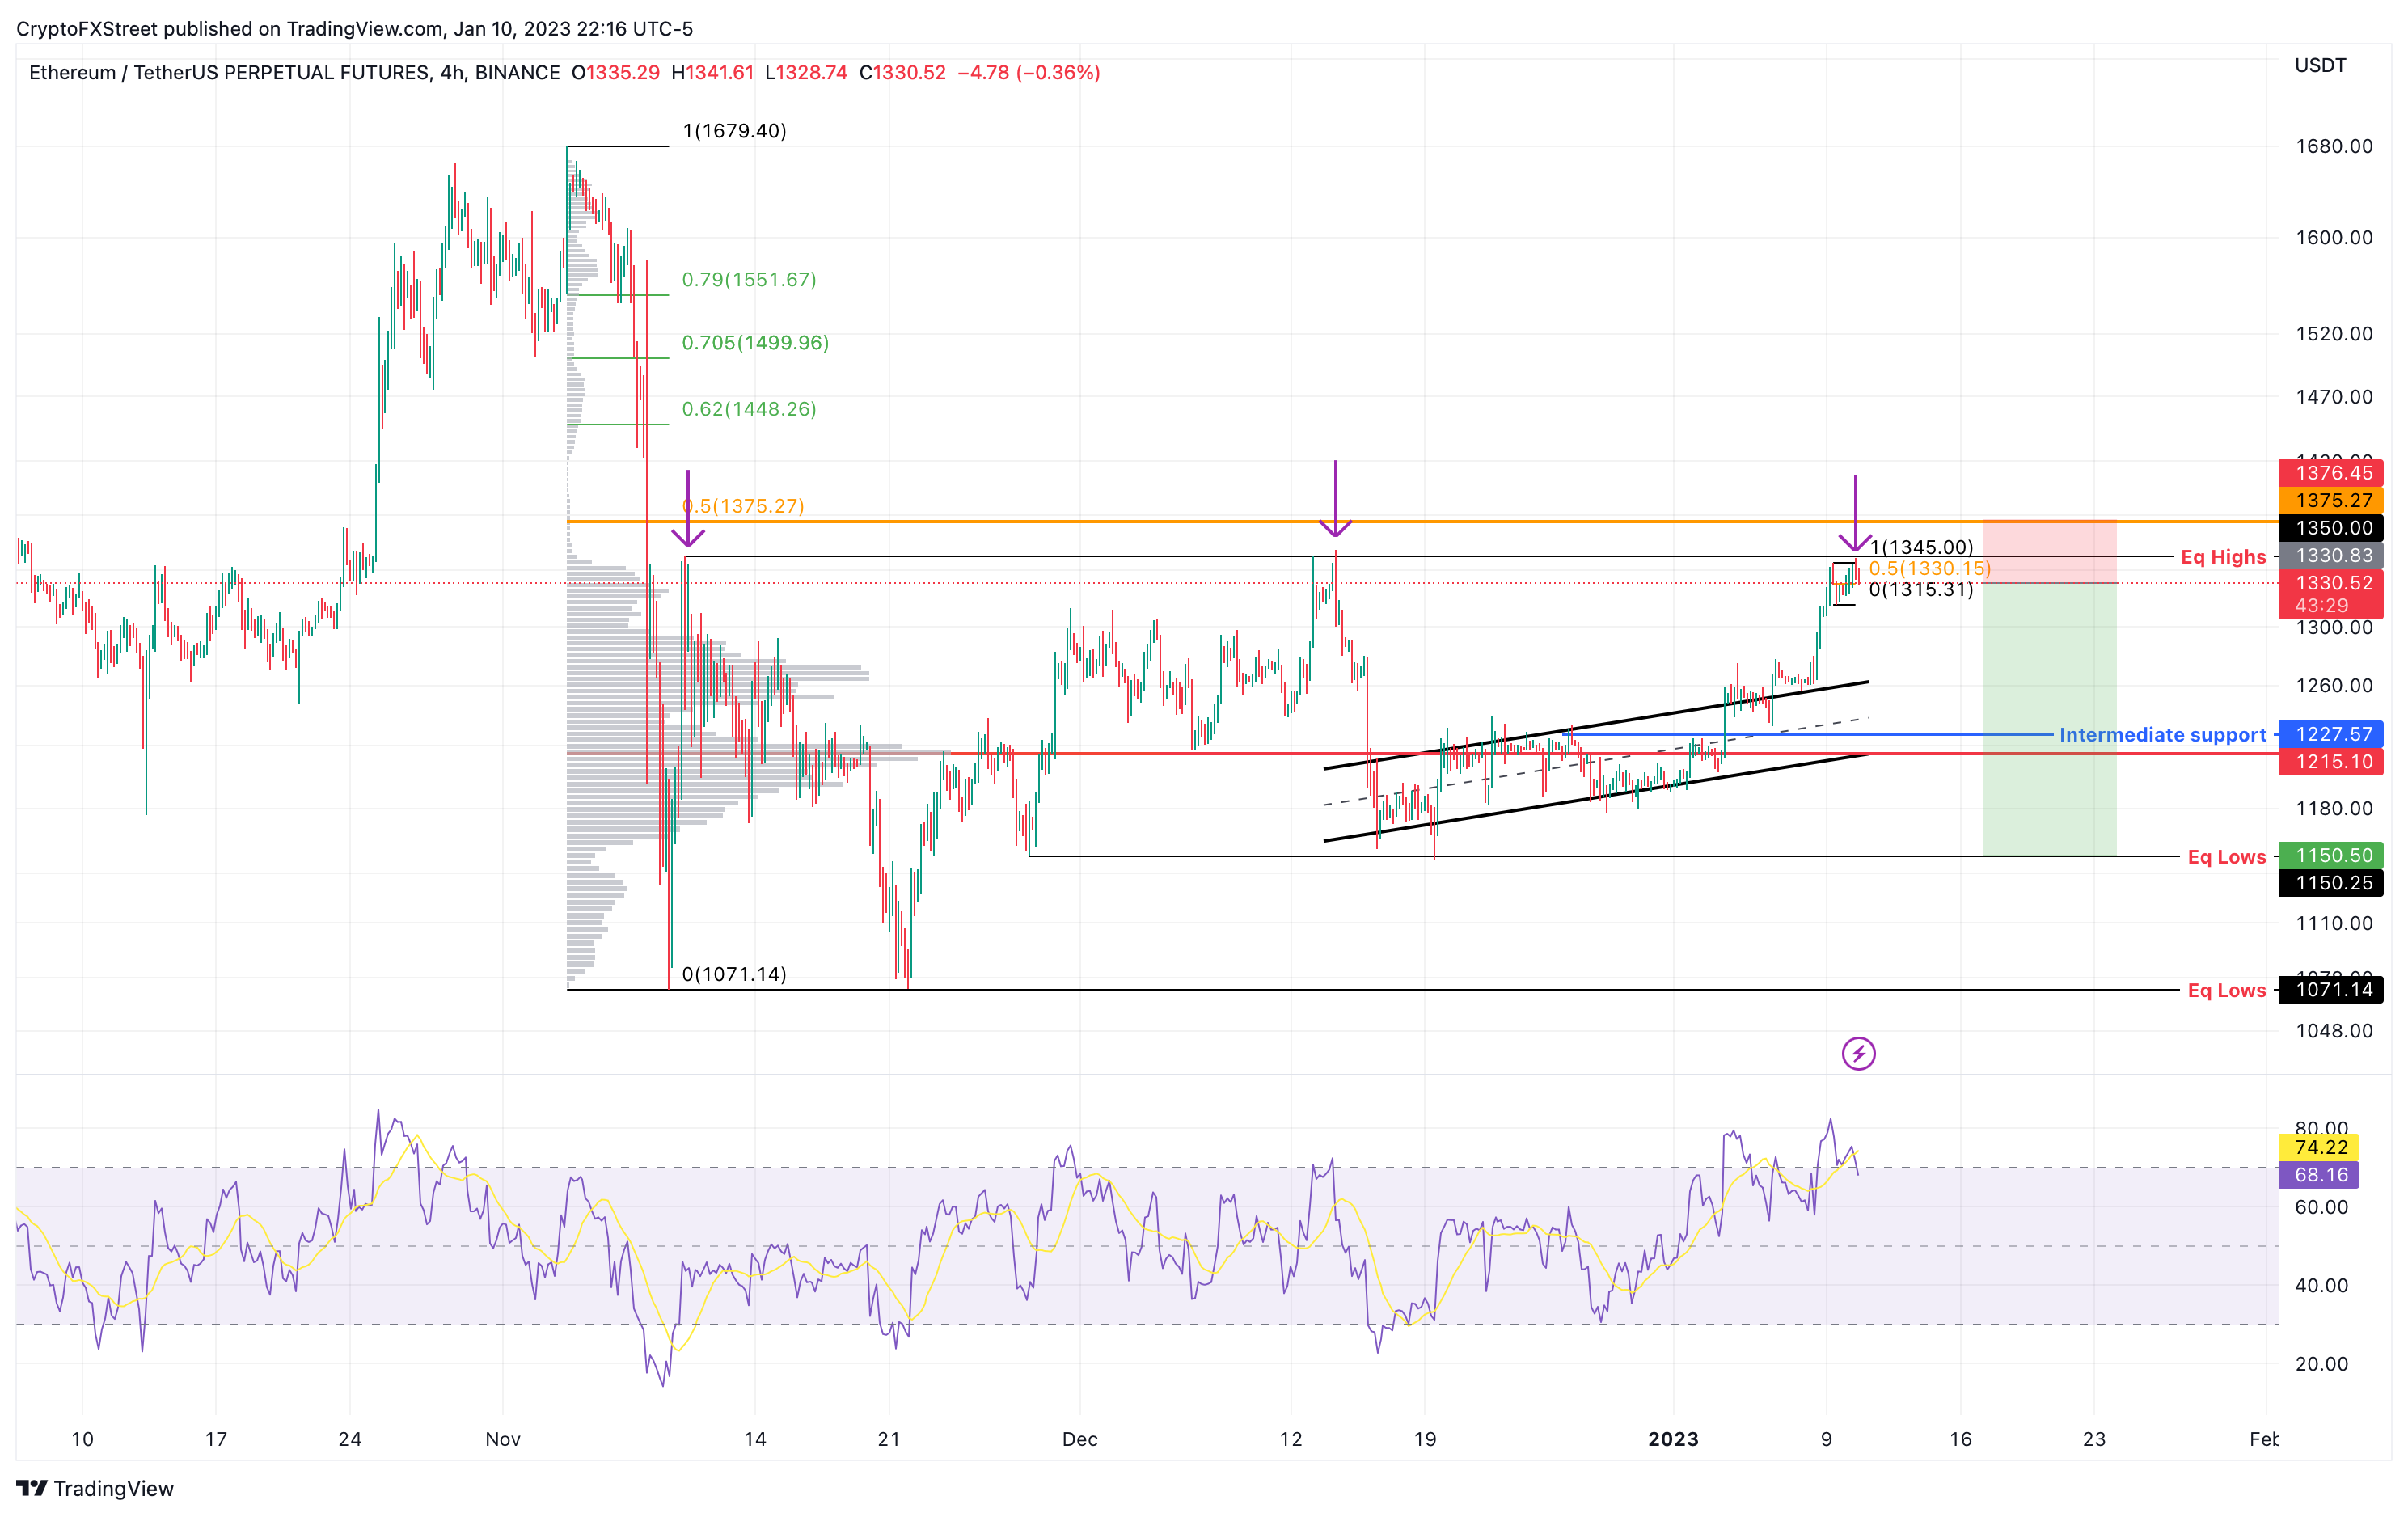
ETH/USDT 4-hour chart
On the other hand, the $1,375 hurdle is a key level for Ethereum price. The volume profile indicator shows that hardly any volume was traded between $1,375 and $1,499. Therefore, a successful flip of the $1,375 barrier into a support floor, will be a significant development for ETH bulls.
Such a move will invalidate the bearish thesis and further propel Ethereum price to revisit the $1,500 psychological level.
Information on these pages contains forward-looking statements that involve risks and uncertainties. Markets and instruments profiled on this page are for informational purposes only and should not in any way come across as a recommendation to buy or sell in these assets. You should do your own thorough research before making any investment decisions. FXStreet does not in any way guarantee that this information is free from mistakes, errors, or material misstatements. It also does not guarantee that this information is of a timely nature. Investing in Open Markets involves a great deal of risk, including the loss of all or a portion of your investment, as well as emotional distress. All risks, losses and costs associated with investing, including total loss of principal, are your responsibility. The views and opinions expressed in this article are those of the authors and do not necessarily reflect the official policy or position of FXStreet nor its advertisers. The author will not be held responsible for information that is found at the end of links posted on this page.
If not otherwise explicitly mentioned in the body of the article, at the time of writing, the author has no position in any stock mentioned in this article and no business relationship with any company mentioned. The author has not received compensation for writing this article, other than from FXStreet.
FXStreet and the author do not provide personalized recommendations. The author makes no representations as to the accuracy, completeness, or suitability of this information. FXStreet and the author will not be liable for any errors, omissions or any losses, injuries or damages arising from this information and its display or use. Errors and omissions excepted.
The author and FXStreet are not registered investment advisors and nothing in this article is intended to be investment advice.
Recommended Content
Editors’ Picks
Ripple on-chain metrics show bullish signs amidst legal struggle with SEC, XRP eyes recovery
Ripple made a comeback above $0.48 on Tuesday and hovers above that level in Wednesday’s European session. Ripple on-chain metrics such as transaction volume and Network Realized Profit/Loss have turned bullish, supporting a recovery in the altcoin.
Bitcoin price falls amidst German government transfers, miners activity
Bitcoin (BTC) extends correction on Wednesday and hovers around $61,000 after finding resistance near the $64,000 level on Monday. Recent on-chain data indicates heightened selling activity from Bitcoin miners early in the week.
Crypto Today: Bitcoin erases gains from end of June, Ethereum declines while Ripple holds
Bitcoin wipes out gains from the last week of June and falls below $60,000 on Wednesday. Ethereum and top altcoins ranked by market capitalization erased gains as the inflation outlook worsened. Ripple holds on to recent gains and hovers above $0.48 on Wednesday.
Three reasons why altcoins could shake off losses this week
On-chain data from Santiment shows that altcoins are currently in the opportunity zone, or generating buy signals. The top three altcoins in the buy zone are Basic Attention Token (BAT), Chromia (CHR), and Highstreet (HIGH), per Santiment.
Bitcoin: BTC price correction could end in July, according to seasonal data
Bitcoin (BTC) price appears poised for a decline this week, influenced by slight outflows in US spot ETFs, selling activity among BTC miners, and a combined transfer of 4,690.28 BTC to centralized exchanges by the US and German governments.