- Ethereum consolidates Friday’s sell-off to 115.80 in Saturday’s trading.
- Last week’s downtrend stays intact amid potential bear flag on the daily chart.
- A retest of 115.00 remains on the cards for the ETH/USD bears.
Having witnessed a volatile trading session on Friday, Ethereum (ETH/USD) is seen consolidating in $10 range so far this Saturday. The second-most traded cryptocurrency lost almost $40 a day before, having rallied as high as $153.32 before crashing to $115.80. The coin did manage to reverse a part of the previous losses, but is still not out of the woods yet, as the recovery lost legs near 137.50 region.
At the time of writing, Ethereum is down nearly 1.50% around 131.50, enjoying a market capitalization of about $ 14.44 billion.
Short-term technical outlook
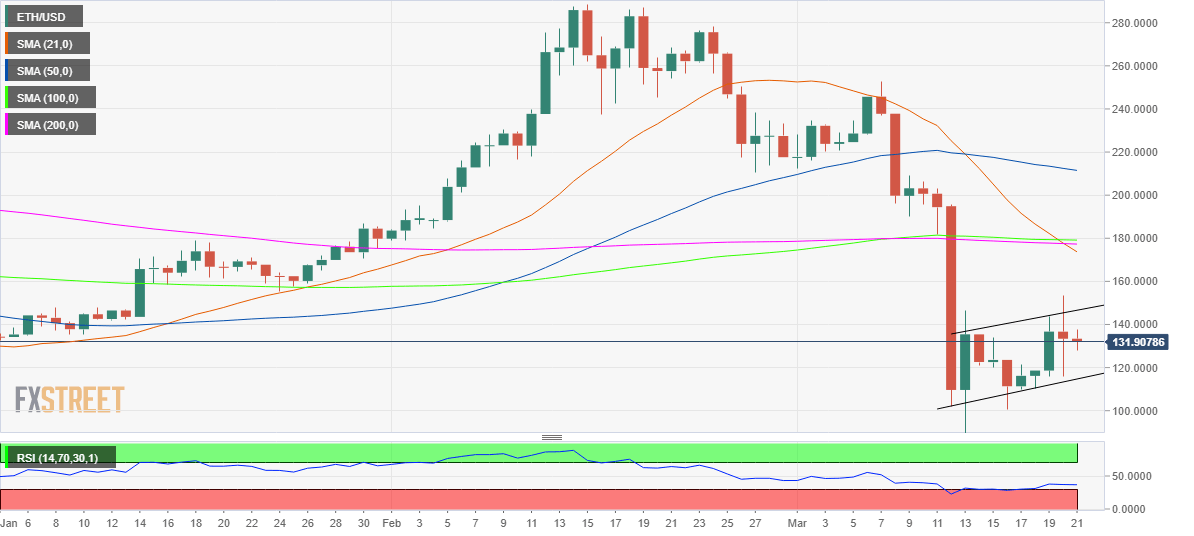
As observed in the daily chart, the price traverses within a rising channel, charting a potential bearish flag pattern. The bearish continuation pattern will get confirmed only on a daily closing below the channel support at 114.70.
Last week’s downtrend will resume below the latter, opening floors for a test of the immediate support seen around 110 levels. A failure to defend the last will put the March 13 low of 89.65 at risk. The daily Relative Strength Index (RSI) trades flat below the mid-line and wells above the oversold territory, suggesting that there is further room for declines. Further, adding strength to the bearish bias, the spot trades below all the major daily Simple Moving Averages (DMA).
On the flip side, the bulls need to portray a sustained breakthrough the immediate resistance located at 146.60, the rising channel resistance, above which the 175.180 area will test the bulls’ commitment. That area is where the horizontal 100 and 200-DMAs intersect with the bearish 21-DMA.
All in all, the path of least resistance appears to the downside amid a bearish pattern formation and a cluster of strong upside barriers stacked up for the bulls to beat.
ETH/USD daily chart
ETH/USD key levels to consider
Information on these pages contains forward-looking statements that involve risks and uncertainties. Markets and instruments profiled on this page are for informational purposes only and should not in any way come across as a recommendation to buy or sell in these assets. You should do your own thorough research before making any investment decisions. FXStreet does not in any way guarantee that this information is free from mistakes, errors, or material misstatements. It also does not guarantee that this information is of a timely nature. Investing in Open Markets involves a great deal of risk, including the loss of all or a portion of your investment, as well as emotional distress. All risks, losses and costs associated with investing, including total loss of principal, are your responsibility. The views and opinions expressed in this article are those of the authors and do not necessarily reflect the official policy or position of FXStreet nor its advertisers. The author will not be held responsible for information that is found at the end of links posted on this page.
If not otherwise explicitly mentioned in the body of the article, at the time of writing, the author has no position in any stock mentioned in this article and no business relationship with any company mentioned. The author has not received compensation for writing this article, other than from FXStreet.
FXStreet and the author do not provide personalized recommendations. The author makes no representations as to the accuracy, completeness, or suitability of this information. FXStreet and the author will not be liable for any errors, omissions or any losses, injuries or damages arising from this information and its display or use. Errors and omissions excepted.
The author and FXStreet are not registered investment advisors and nothing in this article is intended to be investment advice.
Recommended Content
Editors’ Picks

Shiba Inu eyes positive returns in April as SHIB price inches towards $0.000015
Shiba Inu's on-chain metrics reveal robust adoption, as addresses with balances surge to 1.4 million. Shiba Inu's returns stand at a solid 14.4% so far in April, poised to snap a three-month bearish trend from earlier this year.

AI tokens TAO, FET, AI16Z surge despite NVIDIA excluding crypto-related projects from its Inception program
AI tokens, including Bittensor and Artificial Superintelligence Alliance, climbed this week, with ai16z still extending gains at the time of writing on Friday. The uptick in prices of AI tokens reflects a broader bullish sentiment across the cryptocurrency market.

Bitcoin Weekly Forecast: BTC consolidates after posting over 10% weekly surge
Bitcoin price is consolidating around $94,000 at the time of writing on Friday, holding onto the recent 10% increase seen earlier this week. This week’s rally was supported by strong institutional demand, as US spot ETFs recorded a total inflow of $2.68 billion until Thursday.

XRP price could renew 25% breakout bid on surging institutional and retail adoption
Ripple price consolidates, trading at $2.18 at the time of writing on Friday, following mid-week gains to $2.30. The rejection from this weekly high led to the price of XRP dropping to the previous day’s low at $2.11, followed by a minor reversal.
Bitcoin Weekly Forecast: BTC consolidates after posting over 10% weekly surge
Bitcoin (BTC) price is consolidating around $94,000 at the time of writing on Friday, holding onto the recent 10% increase seen earlier this week.

The Best brokers to trade EUR/USD
SPONSORED Discover the top brokers for trading EUR/USD in 2025. Our list features brokers with competitive spreads, fast execution, and powerful platforms. Whether you're a beginner or an expert, find the right partner to navigate the dynamic Forex market.