- Ethereum bounces off support at $415 but is struggling to build momentum above $420.
- ETH/USD upward price action will encounter higher seller congestion at $428 and $432 confluences respectively.
Ethereum price remarkably rose to new yearly highs on Monday as it closed in on the critical level at $450. A two year high was traded at $447 before a reversal came into the picture. Meanwhile, ETH/USD is trading at $422 after retesting and confirming support at $415. The recovery above $420 seems not strong enough and it is apparent that bulls will continue to struggle with building gains towards $430.
Technically, the trend is turning bearish. The RSI, for instance, is almost crossing under the overbought line. If the negative gradient continues, it would not be easy to keep ETH/USD above $415 let alone $420. The Elliot Wave Oscillator also reinforces the increasing sellers’ grip picture a newly printed bearish session. In other words, the path of least resistance remains downwards.
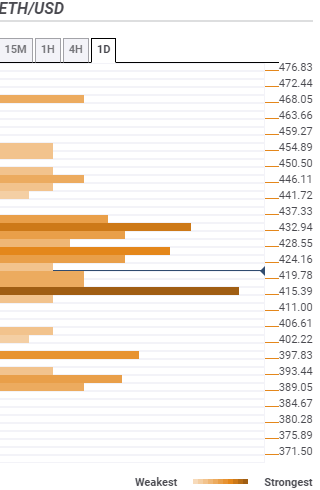
ETH/USD daily chart
-637334016702561188.png)
On the flip side, the wide gap made by the 50-day SMA above the 200-day SMA illustrates that buying pressure is still present only that it is not enough to pull Ether to higher levels past $430. If the short term support at $420 is held in place, we can expect bulls to build on it for action to higher levels in the near term.
Ethereum confluence levels
Resistance one: $424 – Highlighted by the previous low 4-hour, the SMA 10 15-minutes and the previous high 15-minutes.
Resistance two: $428 – Home to the SMA 50 15-minutes, SMA ten 1-hour, the Bollinger Band 15-minutes middle curve and the Fibonacci 23.6% one-week.
Resistance three: $432 – This zone is reinforced by the SMA five one-day, the Bollinger Band 1-hour upper and the pivot point one-month resistance two.
Support one: $419 – A relatively strong buyer congestion area highlighted by the Bollinger Band 4-hour upper and the Fibonacci 23.6% one-day.
Support two: $415 – This is the strongest buyer congestion zone and home to the SMA ten one-day, the SMA 200 1-hour, the previous low one-day and the Fibonacci 38.2% one-week.
Support three: $397 – Zone highlighted by the Fibonacci 61.8% one-week and the Bollinger Band one-day middle curve.
Information on these pages contains forward-looking statements that involve risks and uncertainties. Markets and instruments profiled on this page are for informational purposes only and should not in any way come across as a recommendation to buy or sell in these assets. You should do your own thorough research before making any investment decisions. FXStreet does not in any way guarantee that this information is free from mistakes, errors, or material misstatements. It also does not guarantee that this information is of a timely nature. Investing in Open Markets involves a great deal of risk, including the loss of all or a portion of your investment, as well as emotional distress. All risks, losses and costs associated with investing, including total loss of principal, are your responsibility. The views and opinions expressed in this article are those of the authors and do not necessarily reflect the official policy or position of FXStreet nor its advertisers. The author will not be held responsible for information that is found at the end of links posted on this page.
If not otherwise explicitly mentioned in the body of the article, at the time of writing, the author has no position in any stock mentioned in this article and no business relationship with any company mentioned. The author has not received compensation for writing this article, other than from FXStreet.
FXStreet and the author do not provide personalized recommendations. The author makes no representations as to the accuracy, completeness, or suitability of this information. FXStreet and the author will not be liable for any errors, omissions or any losses, injuries or damages arising from this information and its display or use. Errors and omissions excepted.
The author and FXStreet are not registered investment advisors and nothing in this article is intended to be investment advice.
Recommended Content
Editors’ Picks
XRP funding rates flashes negative, eyes $2.17 following 4% decline
Ripple's XRP declined 4% on Friday following a decline in its funding rates. The remittance-based token could decline to test the $2.17 support level if the crypto market decline extends.

Pro-crypto Senator Lummis likely to chair potential crypto subcommittee
In a post on Thursday, Fox Business reporter Eleanor Terret unveiled the Senate Banking Committee's latest plan to kick off a new subcommittee committed to crypto, likely to be headed by Bitcoin strategic reserve advocate Senator Cynthia Lummis.

Lack of Bitcoin allocation could be risky for nations in 2025: Fidelity
Fidelity Digital Assets' Look Ahead report for the crypto market in 2025 highlights key trends expected for the year, including increased Bitcoin adoption by governments worldwide, broader use cases for stablecoins and more app blockchain launches.

Crypto Today: BTC traders hold $90K support as SUI, LTC, TIA see green
The cryptocurrency market’s losing streak entered its third day; aggregate market cap declined 10.9% to hit $3.1 trillion. Bitcoin price stabilized around the $91,800 area as bulls moved to avoid further downside.
Bitcoin: 2025 outlook brightens on expectations of US pro-crypto policy
Bitcoin price has surged more than 140% in 2024, reaching the $100K milestone in early December. The rally was driven by the launch of Bitcoin Spot ETFs in January and the reduced supply following the fourth halving event in April.

Best Forex Brokers with Low Spreads
VERIFIED Low spreads are crucial for reducing trading costs. Explore top Forex brokers offering competitive spreads and high leverage. Compare options for EUR/USD, GBP/USD, USD/JPY, and Gold.