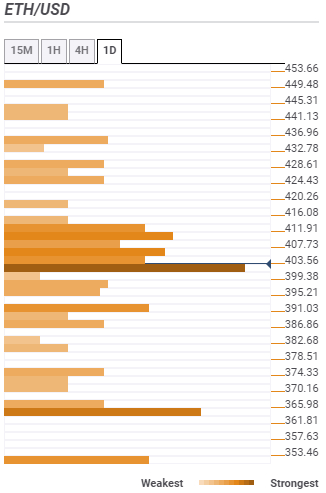
- Ethereum is hanging at the edge of a cliff ($400) as losses eyeing $380 level call.
- ETH/USD bulls are struggling to build momentum above $400; more hurdles await at $407 and $411 respectively.
Ethereum has been nurturing a recovery momentum since the weekend dip to $380. The bulls’ efforts yielded on Monday with Ether reclaiming support at $400. However, the bullish price action was cut short before ETH/USD tested the resistance at $410. A reversal is underway at the time of writing but buyers are keen on keeping the price above $400.
ETH/USD is exchanging hands at $402 amid a gradually building bearish momentum. On the upside, price actions are limited by the 50 SMA in the 4-hour range. In addition, a descending trendline is also limiting movement. The trendline resistance has remained intact from the time Ether traded a new yearly high around $447.
According to other technical levels highlighted by indicators such as the RSI, Ethereum is likely to extend the bearish leg under $400. The RSI is pointing sharply downwards and a slide below the average and towards the oversold is expected in the short term.
On the bright side, the MACD has recovered to touch the midline from lower levels at -6.96. The presence of a bullish divergence from the indicator suggest that buying pressure is also present. However, Ethereum is not attracting enough volume to pull the price above $400 and towards $420.
If push comes to shove and Ethereum slides under $400, a free-fall could refresh the support at $380. The support range between $360 and $380 is expected to continue holding Ethereum from the frequent dips under $400. The 200-day SMA at $375.29 is also inline to prevent declines from wiping off the progress that has been made in the past couple of months.
ETH/USD 4-hour chart
 (88)-637339248877060217.png)
Ethereum Confluence Detector
Resistance one: $403.07 – Highlighted by the previous low 4-hour, the Fibonacci 38.2% one-day, the SMA five 15-minutes and the SMA 100 15-minutes.
Resistance two $407 – Home to the Bollinger Band one-day middle curve, the previous high 1-hour and the SMA 100 4-hour.
Resistance three: $411.41 – Highlighted by the Bollinger band 4-hour upper curve, the SMA 200 1-hour, the Fibo 38.2% one-week and the Bollinger band 1-hour upper curve.
Support one: $398 – As shown by the SMA 100 1-hour, the Bollinger Band 4-hour middle curve, the SMA 200 15-minutes and the Fibo 61.8% one-day.
Support two: $390 – Host the pivot point one-month resistance one.
Support three: $365 – A significant buyer congestion zone and home to the previous year high.
Information on these pages contains forward-looking statements that involve risks and uncertainties. Markets and instruments profiled on this page are for informational purposes only and should not in any way come across as a recommendation to buy or sell in these assets. You should do your own thorough research before making any investment decisions. FXStreet does not in any way guarantee that this information is free from mistakes, errors, or material misstatements. It also does not guarantee that this information is of a timely nature. Investing in Open Markets involves a great deal of risk, including the loss of all or a portion of your investment, as well as emotional distress. All risks, losses and costs associated with investing, including total loss of principal, are your responsibility. The views and opinions expressed in this article are those of the authors and do not necessarily reflect the official policy or position of FXStreet nor its advertisers. The author will not be held responsible for information that is found at the end of links posted on this page.
If not otherwise explicitly mentioned in the body of the article, at the time of writing, the author has no position in any stock mentioned in this article and no business relationship with any company mentioned. The author has not received compensation for writing this article, other than from FXStreet.
FXStreet and the author do not provide personalized recommendations. The author makes no representations as to the accuracy, completeness, or suitability of this information. FXStreet and the author will not be liable for any errors, omissions or any losses, injuries or damages arising from this information and its display or use. Errors and omissions excepted.
The author and FXStreet are not registered investment advisors and nothing in this article is intended to be investment advice.
Recommended Content
Editors’ Picks

Dogecoin and Bitcoin Cash Price Prediction: Funding rates decrease indicate weakness in DOGE and BCH
Dogecoin and Bitcoin Cash registered 3% and 8% losses on Tuesday following increased selling pressure from the futures market. The decline comes amid large-cap cryptos like Bitcoin, Ether and XRP, holding still with slight gains.

XRP could sustain rally amid growing ETF and SEC vote prospects
Ripple flaunted a bullish outlook, trading at $2.1505 on Tuesday. Investor risk appetite has continued to grow since the middle of last week, propping XRP for a sustainable upward move triggered by the swift decision by US President Donald Trump to suspend reciprocal tariffs for 90 days.

VeChain Price Forecast: VET bulls aim for a double-digit rally
VeChain price hovers around $0.023 on Tuesday after breaking above a falling wedge pattern the previous day; a breakout of this pattern favors the bulls. Bybit announced on Monday that VET would be listed on its exchange. Moreover, the technical outlook suggests rallying ahead, targeting double-digit gains.
Dogecoin, Shiba Inu and Fartcoin price prediction if Bitcoin crosses $100K this week
The meme coin market fell sharply on Monday, shedding 4.8% in market capitalization to settle at $49.25 billion, according to data compiled from CoinGecko. The sell-off coincided with increased volatility across broader crypto markets while investors rotated funds into Bitcoin briefly tested $85,000.

Bitcoin Weekly Forecast: Market uncertainty lingers, Trump’s 90-day tariff pause sparks modest recovery
Bitcoin (BTC) price extends recovery to around $82,500 on Friday after dumping to a new year-to-date low of $74,508 to start the week. Market uncertainty remains high, leading to a massive shakeout, with total liquidations hitting $2.18 billion across crypto markets.

The Best brokers to trade EUR/USD
SPONSORED Discover the top brokers for trading EUR/USD in 2025. Our list features brokers with competitive spreads, fast execution, and powerful platforms. Whether you're a beginner or an expert, find the right partner to navigate the dynamic Forex market.