- Ethereum price stuck under $140 after failing to rise above the hostility at $142.
- ETH/USD buyers remain in control but lack a catalyst to support their effort towards $150 and $160 key levels.
Ethereum price hovers under $140 after $142 resistance level became impenetrable for the second time in the same week. Jabs thrown by the bulls on Thursday gained momentum but failed to sustain gains above $140. An attempt to break free from the selling pressure at $140 failed incredibly resulting in losses that touched $138.45 on Friday during the Asian session.
At the time of writing, ETH/USD is trading slightly in the green after adding a mere 0.08% onto its value. Unfortunately, the trend is bearish and the volatility high. This means that sellers have more say unless the buyers come out strongly to shatter the resistance at $142.
Meanwhile, the 2-hour chart shows Ethereum trading above the 50 SMA and the 100 SMA. Besides, the RSI is leveling at 60 after advancing upwards from a weekly low at 35. The Elliot Wave Oscillator has commenced a bullish session to emphasize the bulls are gaining traction, although gradually. $142 is the wall between Ethereum and higher levels at $150 and $160 respectively.
ETH/USD 2-hour chart
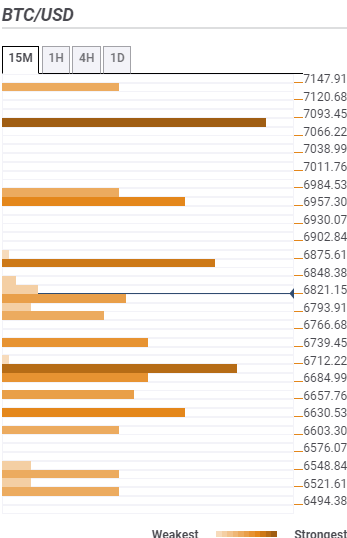
According to the confluence detector Ethereum has more stacks of support in comparison to the available hurdles. In other words, ETH/USD could sail smoothly above $160 on finding a catalyst. However, downward corrections will have a difficult time navigating the many buyer congestion zones.
Resistance one: $141.45 – Home to the Fibo 23.6% one-week and the Bollinger Band 4-hour upper curve.
Resistance two: $148.38 – Highlighted by the pivot point one-day resistance three and the BB one-day middle curve.
Resistance three: $154.16 – Home to the previous week high.
Support one: $136.81 – Highlighted by the SMA 100 15-mins, SMA 100 4-hour, BB 4-hour middle curve and the SMA 200 15-mins.
Support two: $133.92 – Hosts the Fibo 38.2% one-week and the previous low one-day.
Support three: $129.58 – Where the Fibo 161.8% one-day and the pivot point one-day support three converge.
Information on these pages contains forward-looking statements that involve risks and uncertainties. Markets and instruments profiled on this page are for informational purposes only and should not in any way come across as a recommendation to buy or sell in these assets. You should do your own thorough research before making any investment decisions. FXStreet does not in any way guarantee that this information is free from mistakes, errors, or material misstatements. It also does not guarantee that this information is of a timely nature. Investing in Open Markets involves a great deal of risk, including the loss of all or a portion of your investment, as well as emotional distress. All risks, losses and costs associated with investing, including total loss of principal, are your responsibility. The views and opinions expressed in this article are those of the authors and do not necessarily reflect the official policy or position of FXStreet nor its advertisers. The author will not be held responsible for information that is found at the end of links posted on this page.
If not otherwise explicitly mentioned in the body of the article, at the time of writing, the author has no position in any stock mentioned in this article and no business relationship with any company mentioned. The author has not received compensation for writing this article, other than from FXStreet.
FXStreet and the author do not provide personalized recommendations. The author makes no representations as to the accuracy, completeness, or suitability of this information. FXStreet and the author will not be liable for any errors, omissions or any losses, injuries or damages arising from this information and its display or use. Errors and omissions excepted.
The author and FXStreet are not registered investment advisors and nothing in this article is intended to be investment advice.
Recommended Content
Editors’ Picks
Bitcoin Weekly Forecast: BTC bloodbath continues, near 30% down from its ATH
Bitcoin price extends its decline and trades below $80,000 at the time of writing on Friday, falling over 15% so far this week. This price correction wiped $660 billion of market capitalization from the overall crypto market and saw $3.68 billion in total liquidations this week.
Cardano poised for double-digit drop amid market weakness
Cardano price is extending its decline by nearly 7%, trading around $0.60 on Friday after falling 23% this week. Santiment data support this decline as ADA daily active addresses are falling, and the technical outlook indicates a continued correction, with ADA potentially facing an additional double-digit decline.
XRP short-term holders dominate sell-off as whales buy the dip
XRP short-term holders dominated the selling activity during the recent market crash. XRP whales have been accumulating more tokens during the crash, adding over $1 billion worth of tokens. XRP could bounce off the lower boundary of a descending channel if it fails to hold the $1.96 support level.
Top 3 Price Prediction Bitcoin, Ethereum, Ripple: BTC, ETH and XRP continue to sell off
Bitcoin (BTC) price continues declining on Friday after falling more than 15% this week. Ethereum (ETH) and Ripple (XRP) followed BTC’s footsteps and declined by nearly 24% and 21%, respectively.
Bitcoin: BTC bloodbath continues, near 30% down from its ATH
Bitcoin (BTC) price extends its decline and trades below $80,000 at the time of writing on Friday, falling over 15% so far this week. This price correction wiped $660 billion of market capitalization from the overall crypto market and saw $3.68 billion in total liquidations this week.
The Best brokers to trade EUR/USD
SPONSORED Discover the top brokers for trading EUR/USD in 2025. Our list features brokers with competitive spreads, fast execution, and powerful platforms. Whether you're a beginner or an expert, find the right partner to navigate the dynamic Forex market.