Ethereum Price Prediction: ETH top-down analysis hints upside is capped at $2,500
- Ethereum price trades in a clear consolidative trend on the weekly time frame between $1,933 and $2,141 barriers.
- The daily chart for ETH shows a sweep of Monday’s high is likely to be followed by a sweep of Monday’s low at $1,985.
- If Bitcoin price undergoes a steep double-digit correction, Ether could also slide to $1,933 and $1,829 support levels.

Ethereum (ETH) price shows an ongoing consolidation with no directional bias. But a closer look at the daily chart shows that a potential correction might ensue, especially if Ether is influenced by Bitcoin (BTC).
Ethereum price prediction thesis and short-term bias
According to Exchange-Traded Fund (ETF) analysts, Bitcoin spot ETF is likely to be approved in January 2024. This development has caused FOMO among market participants, making the overall market outlook resoundingly bullish. Interestingly, this is one of the main drivers of the 2023 bull rally.
Read more: Week Ahead: Bitcoin’s bull trend in question as spot ETF momentum fades
But as the holiday season begins to kick in, liquidity in the market will diminish. Hence, cryptocurrency prices are likely to face manipulation. Additionally, Bitcoin price has already started to slow down its rally and has flashed multiple sell signals.
If Bitcoin price faces a minor correction, altcoins will shed double digits easily due to the nature of the connection between the two. Likewise, the Ethereum price will also see a correction to key support levels.
Read more: Bitcoin Weekly Forecast: ETF delay and weekly swing failure could crash BTC to $30,000
This top-down Ethereum price analysis takes a look at ETH from weekly and daily time frames and forecasts buy-the-dip levels.
Ethereum price at critical levels on the weekly chart
Ethereum price has been in a multi-month consolidative trend that has produced an ascending triangle setup. While the technical formation is inherently bullish, it is only after a successful breakout. So far, ETH has not produced any discernible breakouts, just failed attempts.
The ascending triangle setup contains equal highs and higher lows, connected via trend lines. This setup shows that investors are becoming increasingly bullish and buying dips at an increasing rate.
A breakout above the $2,000 psychological level was the first sign of a bullish move, but there has been a lot of back-and-forth around this level. To be precise, ETH is hovering between the second quarter high at $2,141 and weekly support at $1,933. This has been happening for the fourth consecutive week.
With Bitcoin’s trend weakening and signaling a potential double-digit correction, Ethereum price might also catalyze a downside move to flush early longs. In such a case, ETH might eye a retest of the monthly open at $1,814 and a sweep of the monthly low at $1,782. This move would constitute a 9% to 12% move.
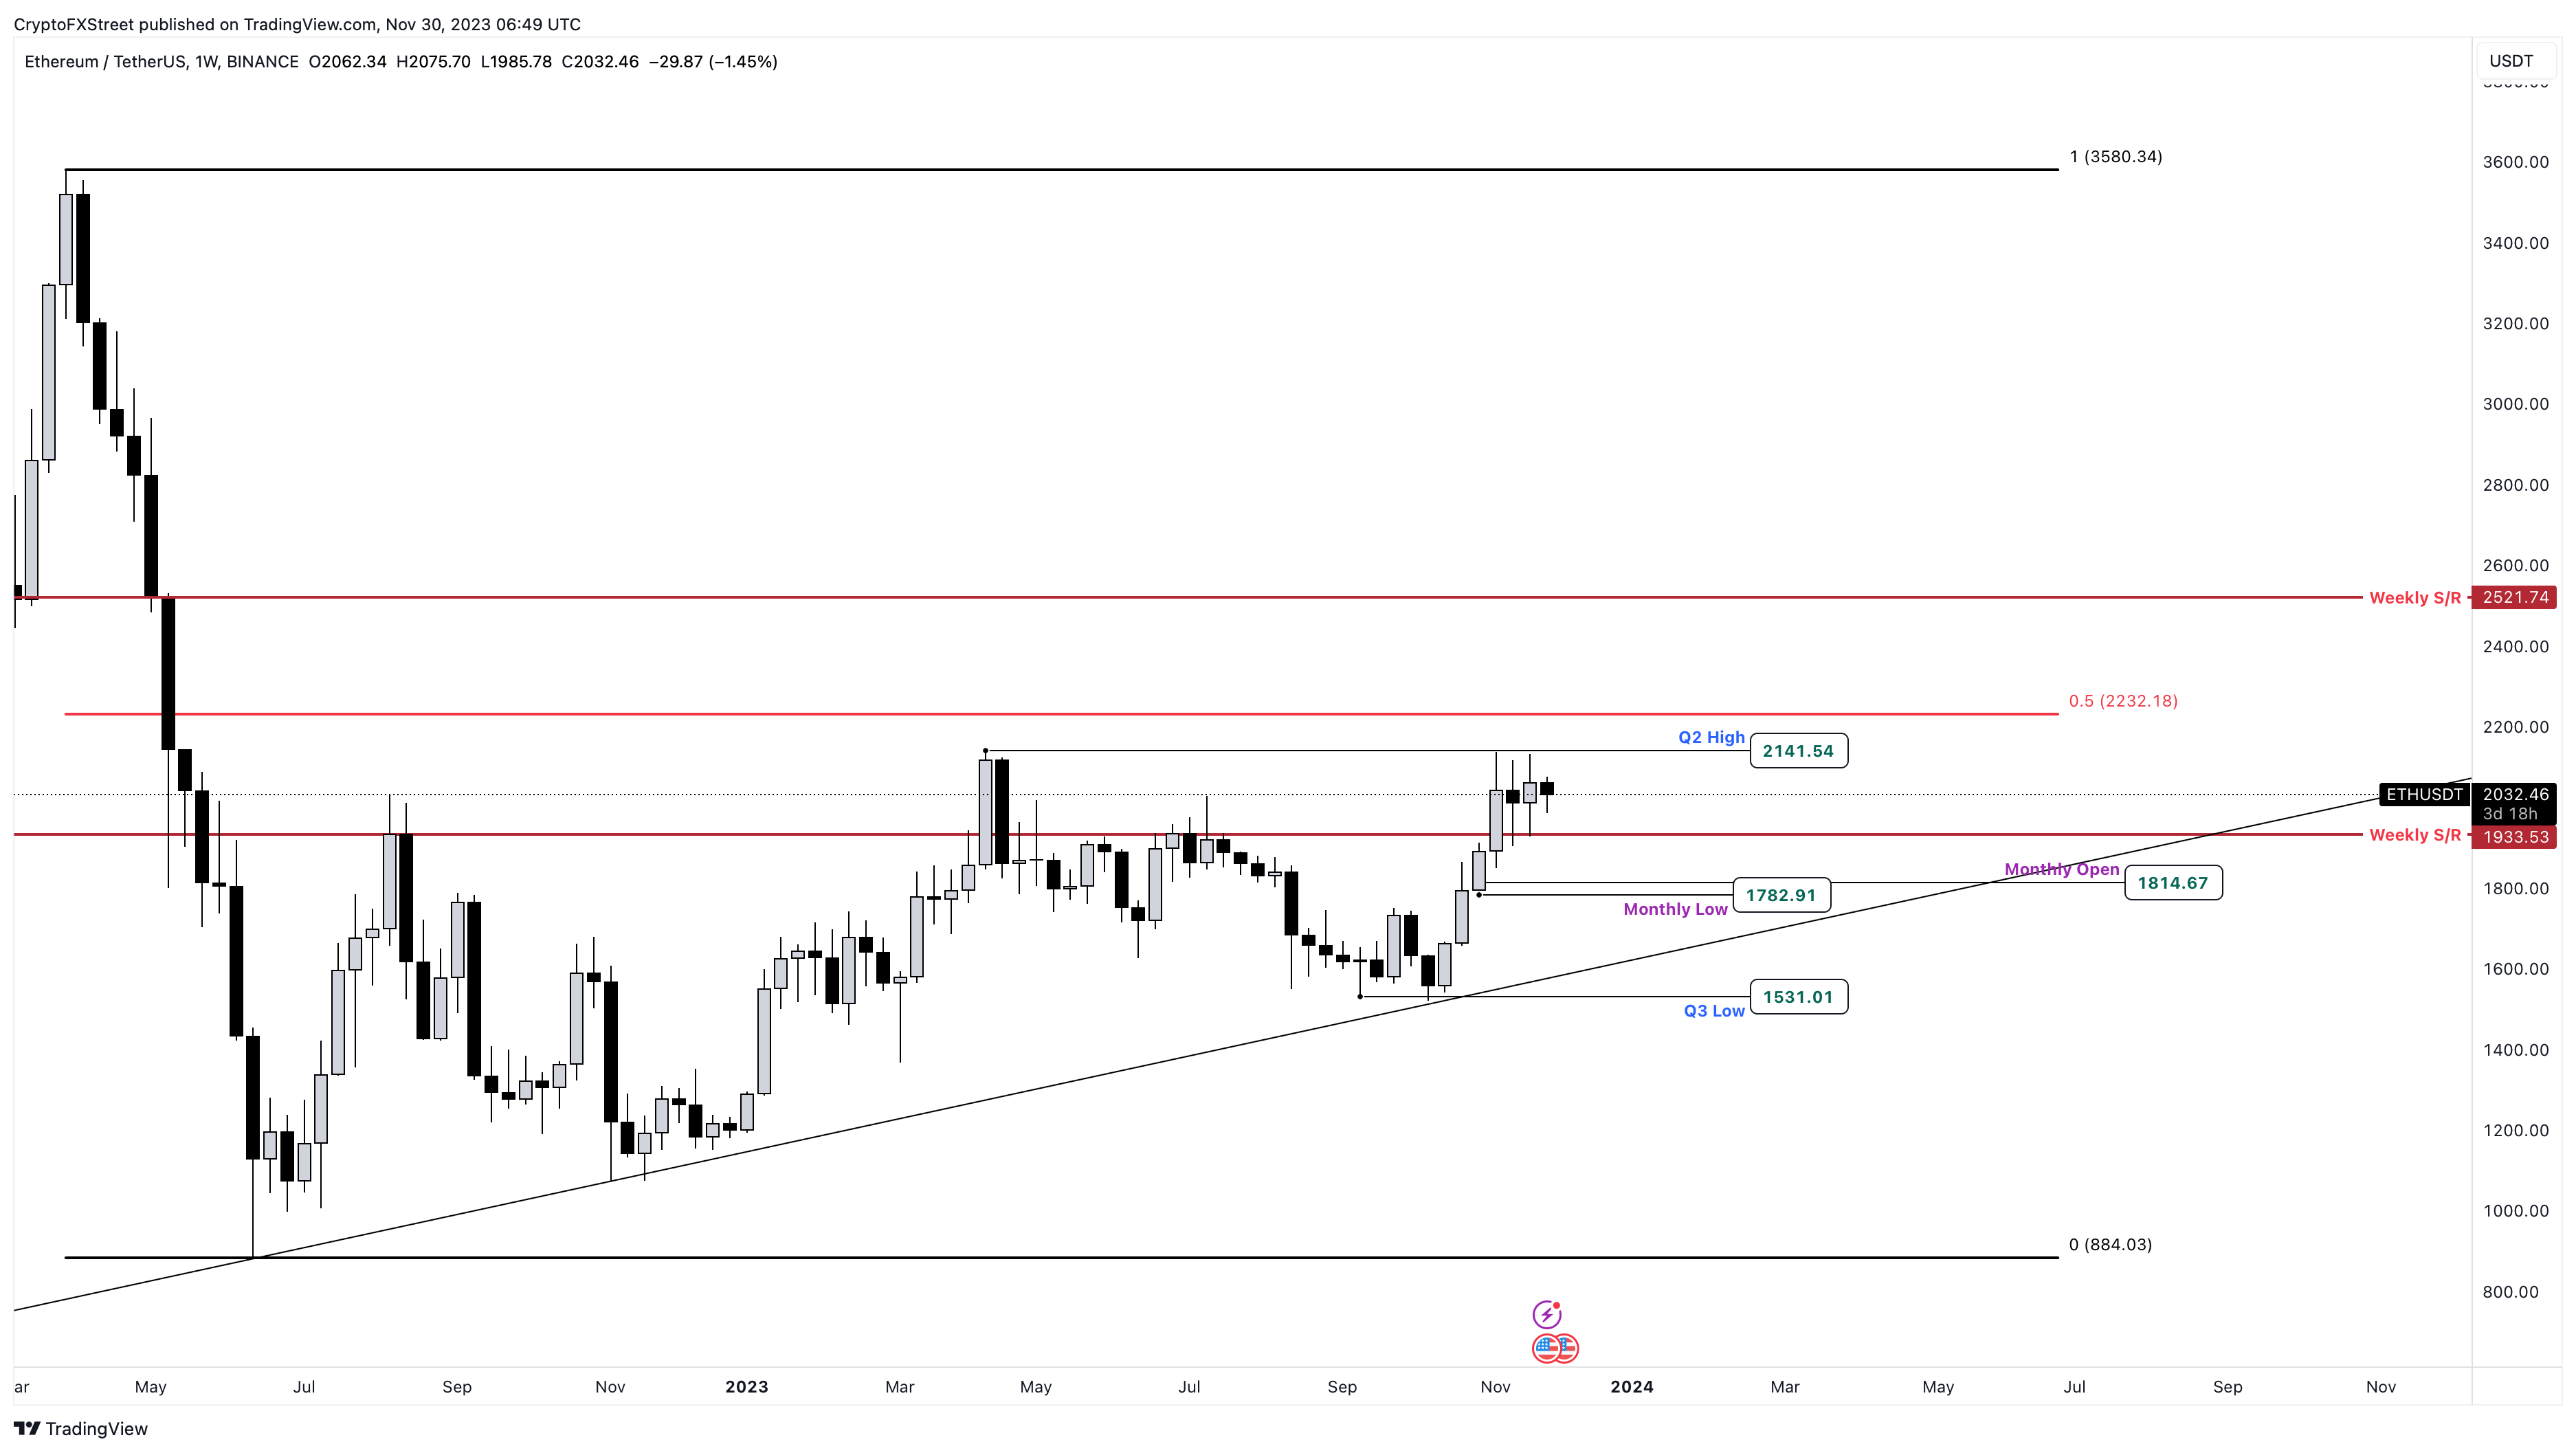
ETH/USDT 1-week chart
ETH bulls likely to take a backseat soon
The daily chart for Ethereum price shows more nuanced key levels, some of which coincide with the ones seen on the weekly.
For starters, this week’s Monday range extends from $2,071 to $1,985. While the Monday high was swept on November 28, investors can expect a sweep of the Monday low in the coming days.
A quick move to the downside with the intention of sweeping Monday’s range could lead to a steep correction, especially if it is backed by BTC bears. In that case, investors need to take a look at the 40% Ethereum price rally witnessed between October 12 and November 10. This upswing created a local top at $2,138, and the midpoint of this move rests at $1,829, which coincides closely with the monthly open at $1,814 and monthly close of $1,782.
All in all, the $1,750 to $1,850 range seems like a good place to buy the dip if it ever comes to that.
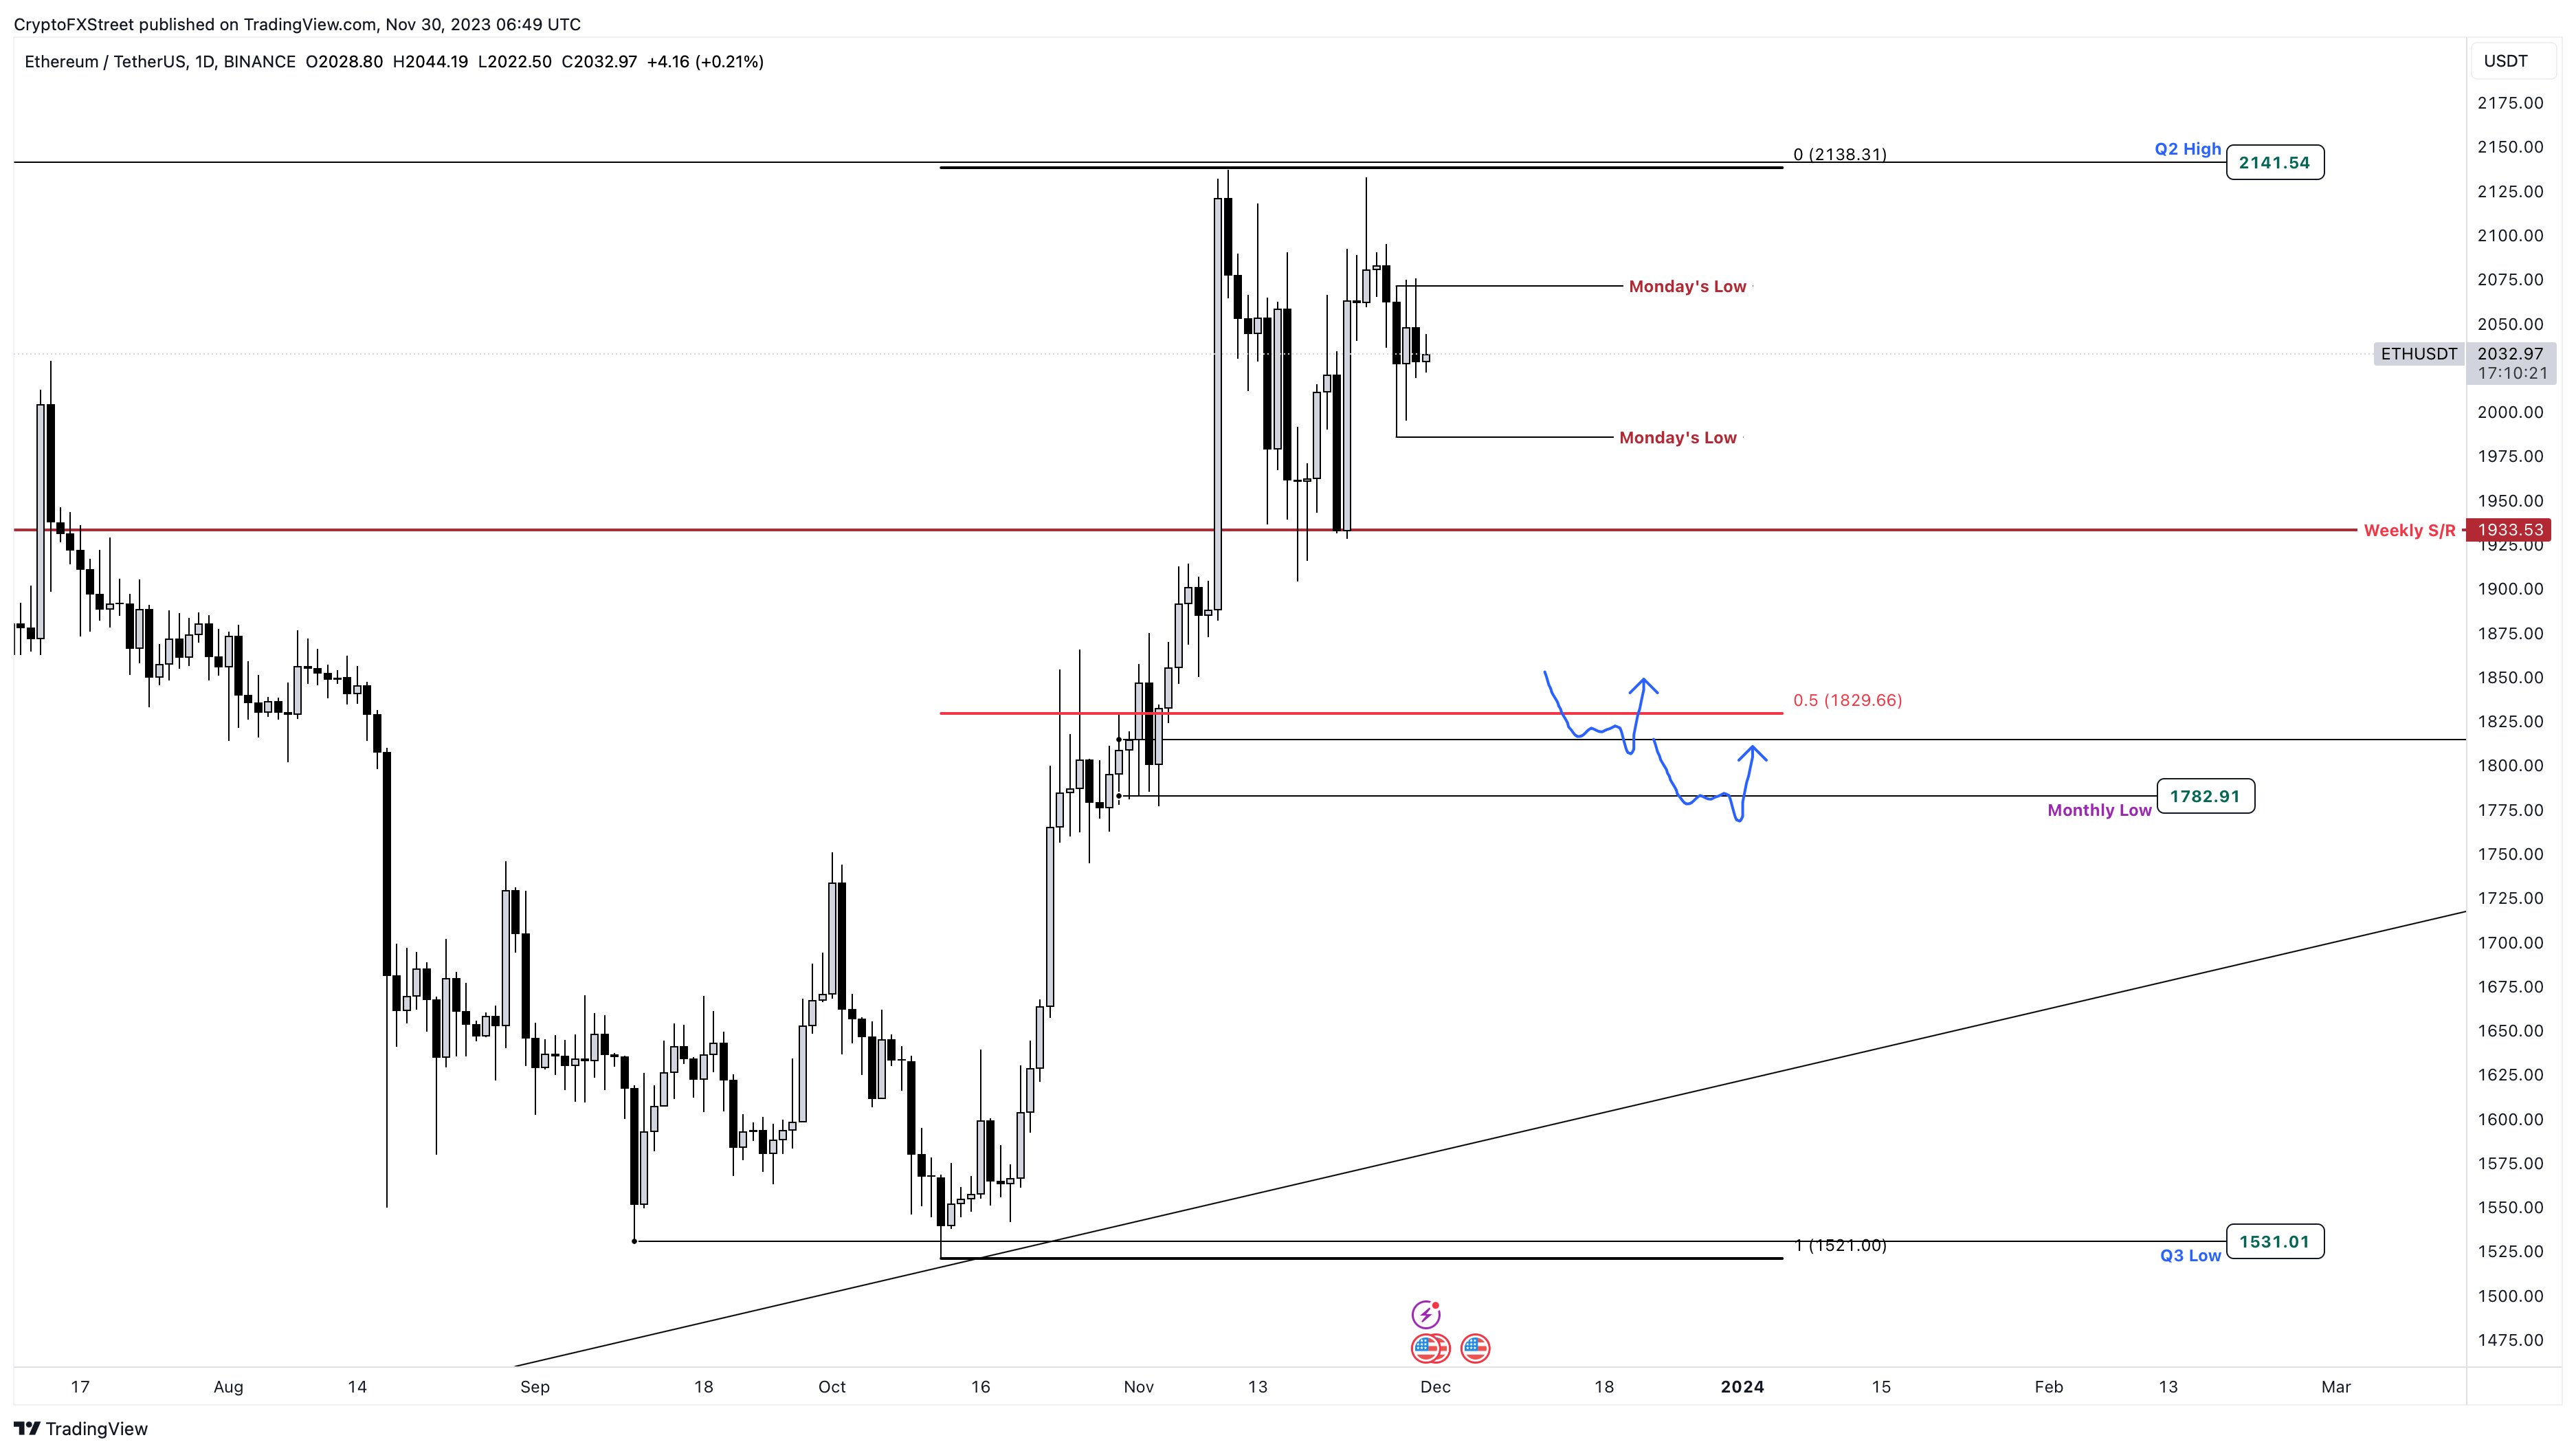
ETH/USDT 1-day chart
While the short-term bearish or correction outlook is logical, it is completely contingent on Bitcoin’s sell signals. If BTC lures shorts via a minor correction and proceeds to blast through $40,000, it would obliterate short sellers and cause a massive liquidation event that could sustain a move beyond $40,000.
In such a case, Ethereum price could overcome the $2,232 hurdle and eye a retest of the weekly resistance level at $2,521.
Author

Akash Girimath
FXStreet
Akash Girimath is a Mechanical Engineer interested in the chaos of the financial markets. Trying to make sense of this convoluted yet fascinating space, he switched his engineering job to become a crypto reporter and analyst.


