Ethereum Price Prediction: ETH needs pullback to keep its upswing intact
- Ethereum price bullish momentum slowing down as it swings toward the 200% Fibonacci extension level at $4,171.94.
- The MRI has flashed a sell signal on the 6-hour chart indicating a correction might be on its way.
- The majority of the on-chain indicators suggest a bullish outlook for ETH.

Ethereum price has had a stellar performance over the past two weeks, breaking records. Now, ETH bulls might take a break as this indicator flashed a sell signal.
Ethereum price might retrace to onboard sidelined investors
Ethereum price shows that its parabolic move that led to a new all-time high above $4,000 is still intact. This rally started around $2,200 on April 24 and has shattered previous highs non-stop.
The Momentum Reversal Indicator has flashed a cycle top signal in the form of a red ‘one’ candlestick on the 6-hour chart, indicating that Ethereum price could retrace.
This setup forecasts a one-to-four candlestick correction. Therefore, if this move were to manifest, ETH could slide toward the immediate demand zone that stretches from $3,815 to $3,983.
Although unlikely, Ethereum price could slide 6% to 162% Fibonacci extension level at $3,553 if the barrier mentioned above is breached.
While this pullback is a short-term play, the altcoin pioneer remains bullish from a long-term perspective. Hence, investors should expect ETH to slice through the 200% Fibonacci extension level at $4,171.94.
If the buying pressure persists beyond this point, Ethereum price could climb another 10% to $4,614, which coincides with the 227.2% Fibonacci extension level.
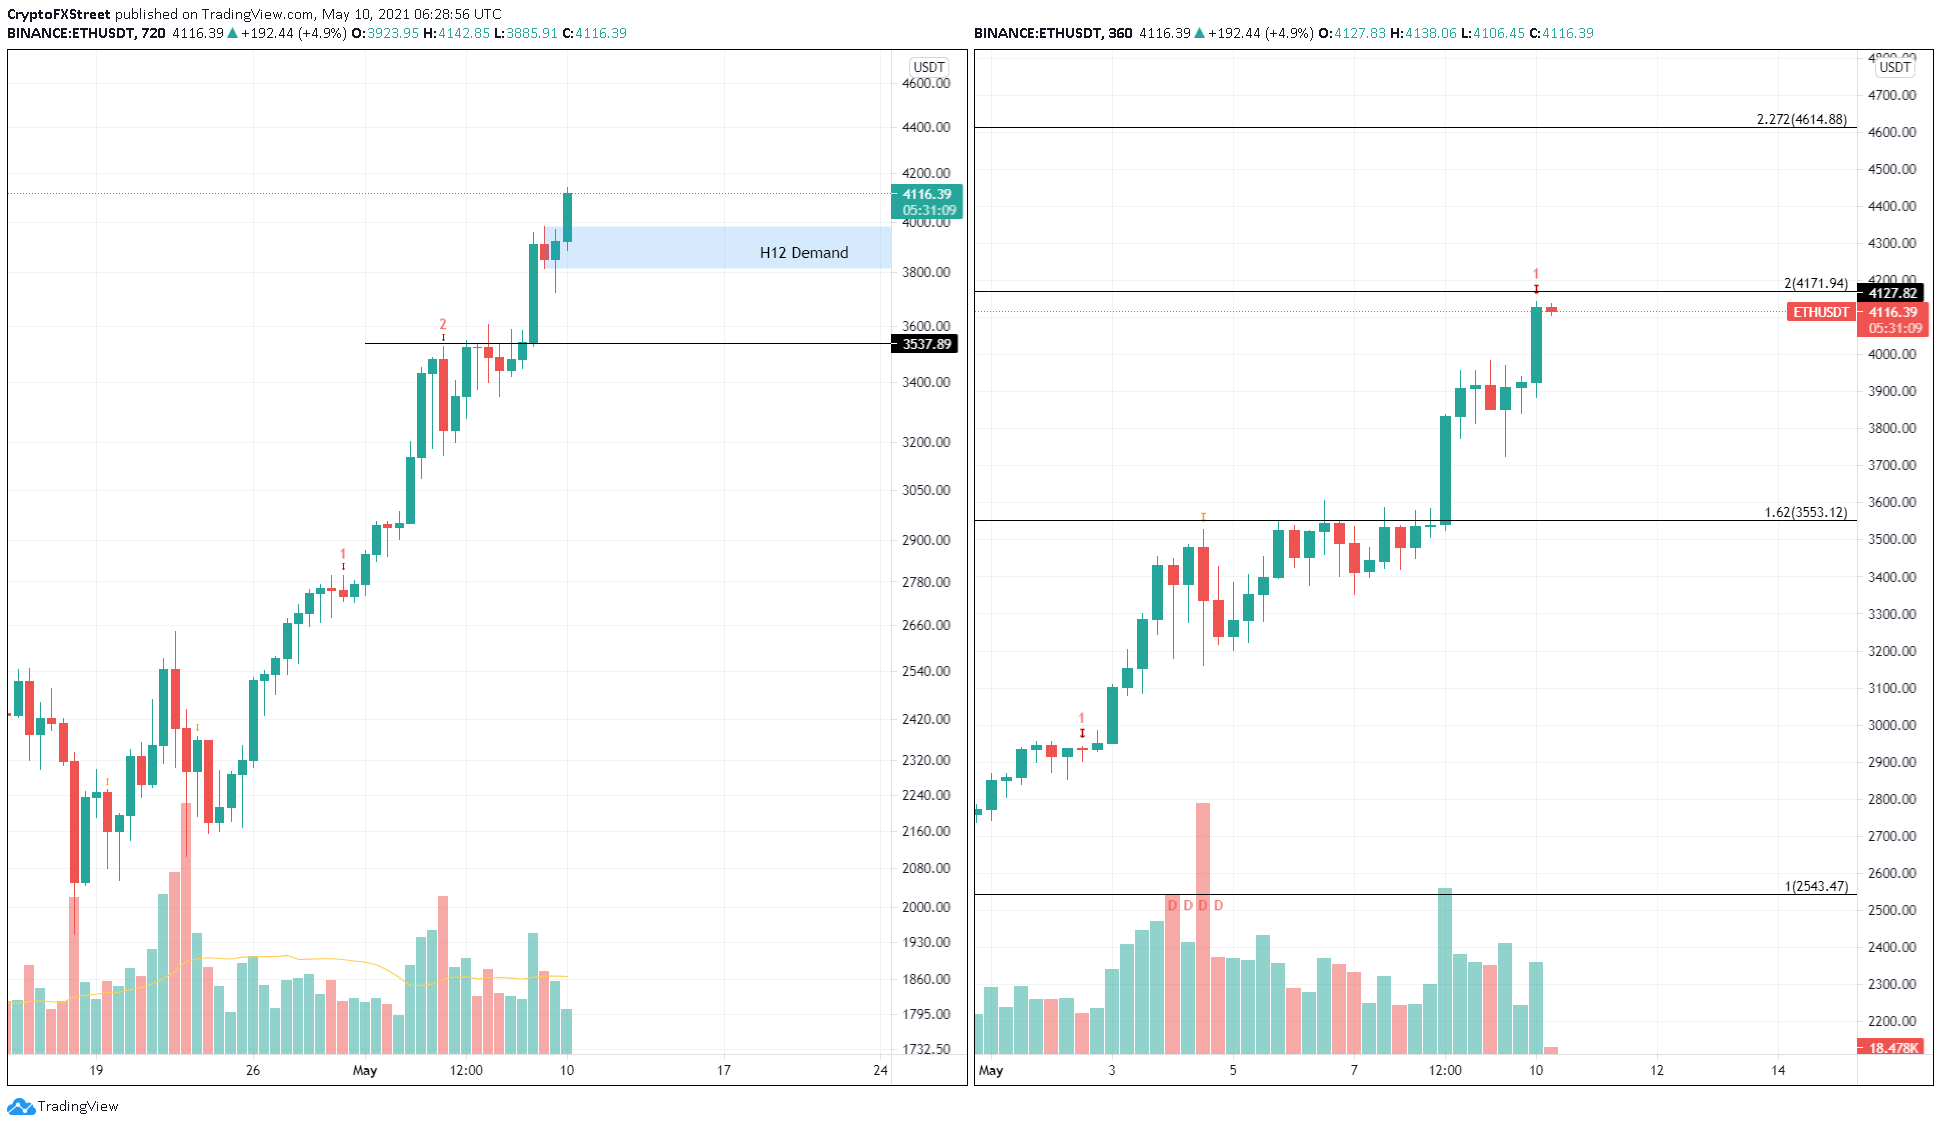
ETH/USDT 12-hour, 6-hour chart
The number of active addresses transacting on the Ethereum blockchain has been on a constant surge. Since May 1, this metric has seen an 18.76% increase from 666,000 to 791,000.
Although the number of users depositing their ETH holdings on to exchanges has increased by 26% since May 1, it has nosedived nearly 54% since October 23. This decline represents investors’ unwillingness to book profits at the current levels, thus painting a long-term bullish picture.
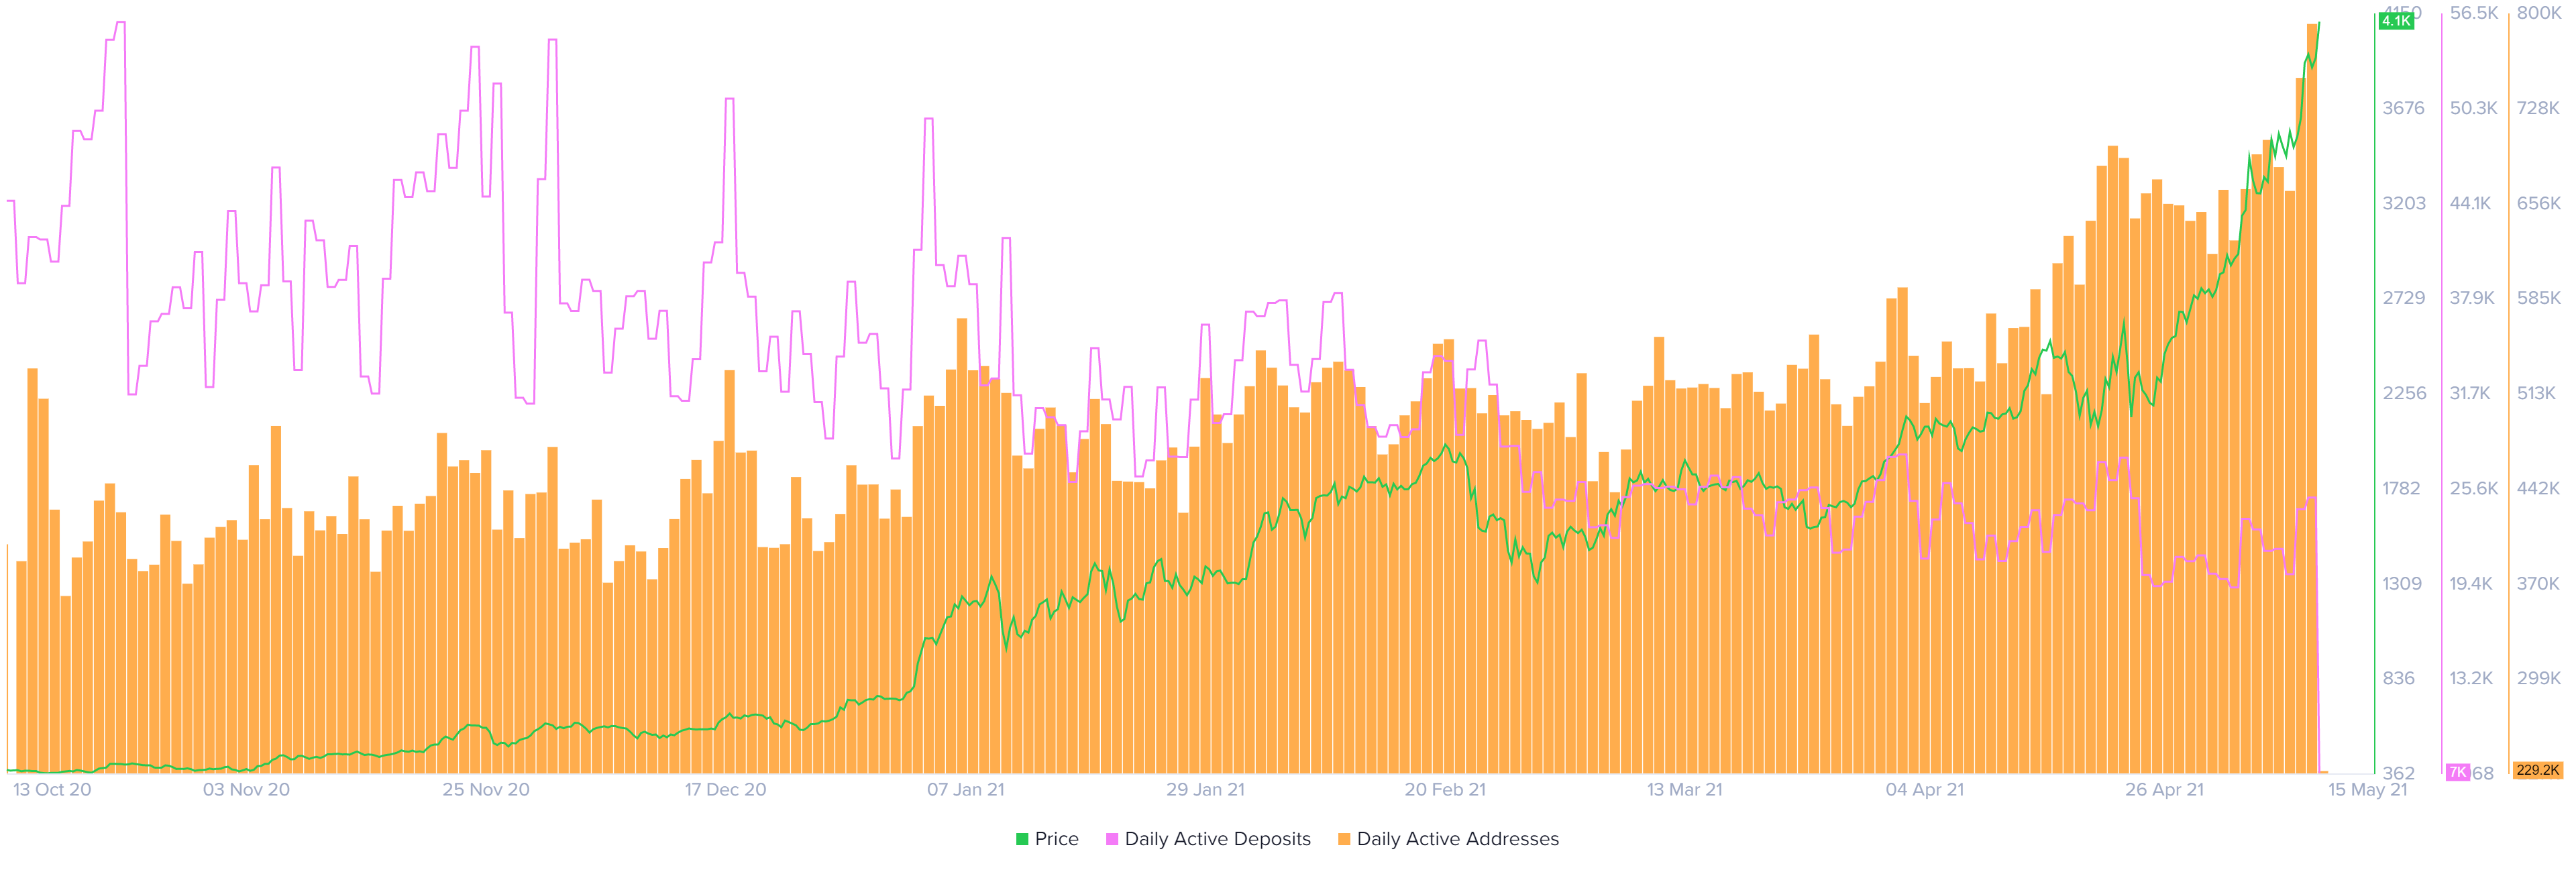
ETH daily active addresses and daily active deposits chart
The number of whales holding between 100,000 to 10,000,000 ETH has been significant in moving Ethereum price.
A total of 55 new investors that fall in this category have joined the network since May 1, increasing their count from 1,298 to 1,353. Such an increase can be considered bullish as this metric can be used as a proxy to their investment interest.
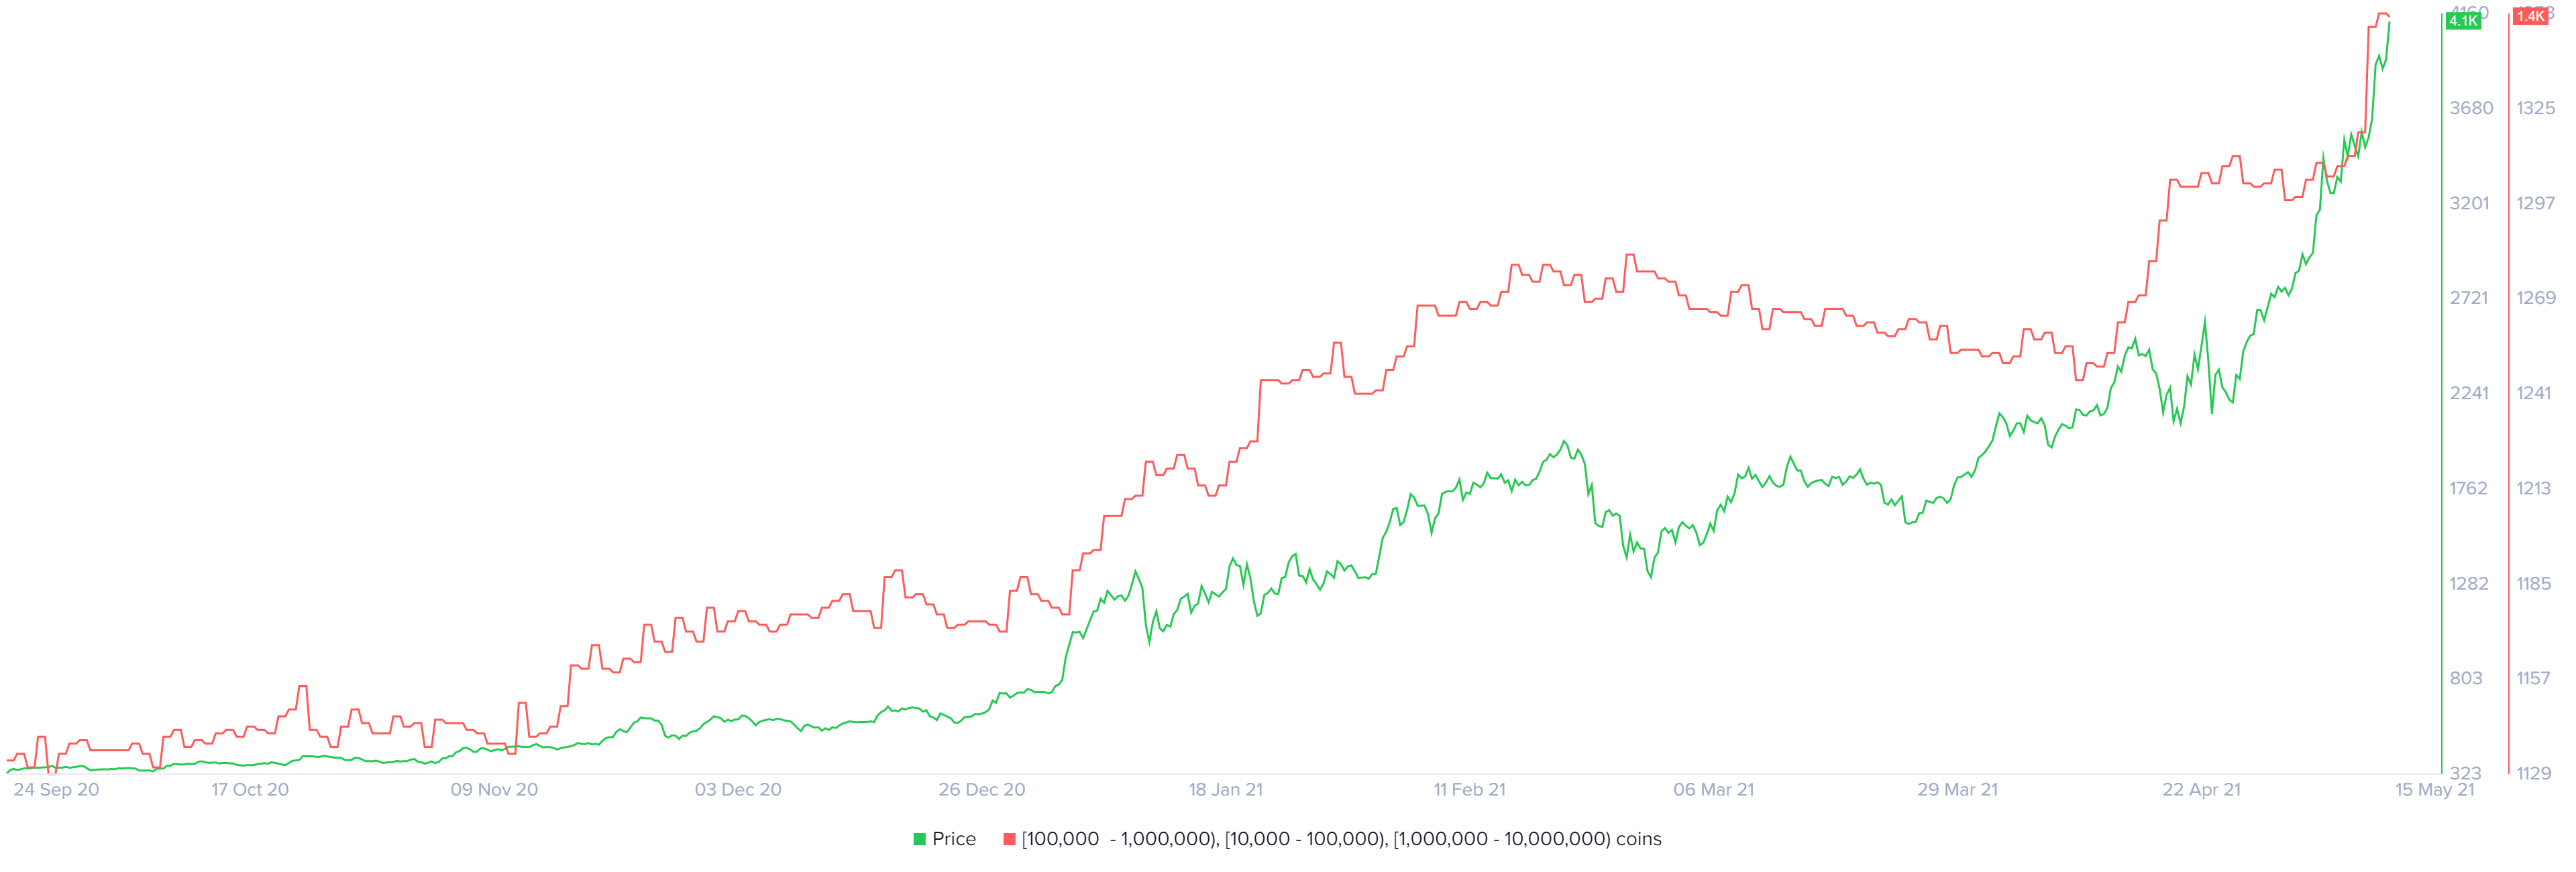
ETH supply distribution chart
While the overall outlook for the second-largest cryptocurrency by market capitalization is bullish, participants in profit have hit a peak, suggesting that profit-taking en masse could negatively impact ETH price, and lead to a massive correction.
Supporting this bearish outlook is the MVRV Z-score metric, which is the ratio of the difference between the Market capitalization and realized capitalization and the standard deviation of the market capitalization.
Put simply, this fundamental index is used to assess if an asset is overvalued relative to its fair value. At the time of writing, ETH’s MVRV Z-score is at 7.87, which is very close to the 2018 highs, located at 8.97. Such a measure shows that ETH is overvalued and that a majority of the network participants are in the money.
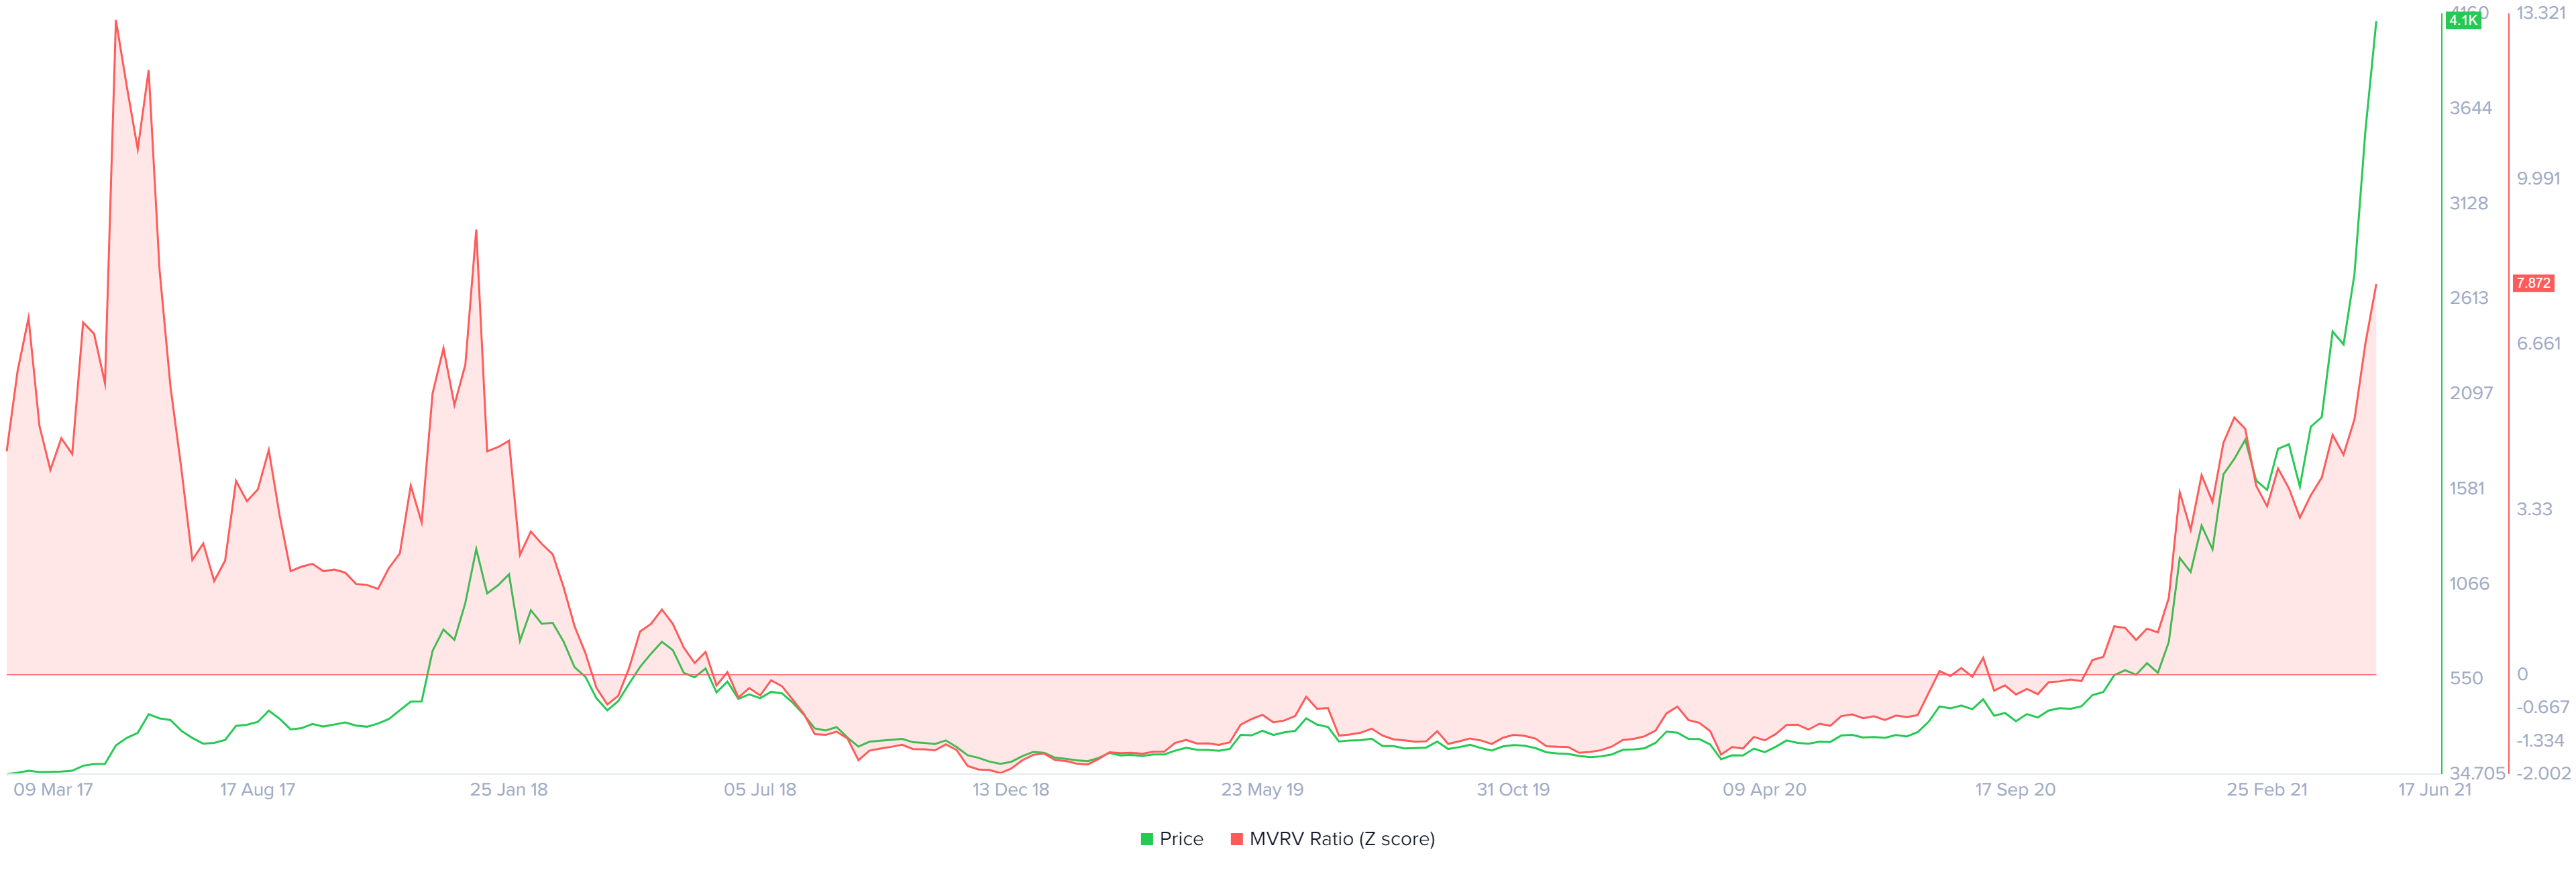
ETH MVRV Z-score chart
Hence, investors might book profits, which could easily shatter the demand zone mentioned above and extend this correction. If Ethereum price produces a decisive close below $3,353, it would create a lower low and invalidate the bullish outlook.
In such a case, the sellers could drag ETH by 24% up to $2,543.
Author

Akash Girimath
FXStreet
Akash Girimath is a Mechanical Engineer interested in the chaos of the financial markets. Trying to make sense of this convoluted yet fascinating space, he switched his engineering job to become a crypto reporter and analyst.


