Ethereum Price Prediction: ETH heads back to $2,000 after holding key support
- Ethereum has reclaimed support above $1,600 after bouncing off the 38.2% Fibonacci level.
- Massive exchange withdrawal suggests that investors’ risk appetite for ETH is still high.
- The MACD’s downward slope shows that Ether is not out of the woods and further losses are probable.

Ethereum dived below several key support levels, including $1,700 and $1,650, before embracing the buyer congestion zone at $1,540. A recovery is underway, with bulls having stepped above $1,600. Price action beyond the 50% Fibonacci level is likely to pave the way for gains eyeing $2,000.
Ethereum bulls nurture uptrend toward $2,000
Ether is doddering at $1,610 at the time of writing. Support at $1,520, as highlighted by the 38.2% Fibonacci level, barricaded the losses from progressing to $1,400. Meanwhile, buyers are looking forward to slicing through the short-term support at the 50% Fibo level. Note that buy orders could be triggered here, thus strengthening the tailwind.
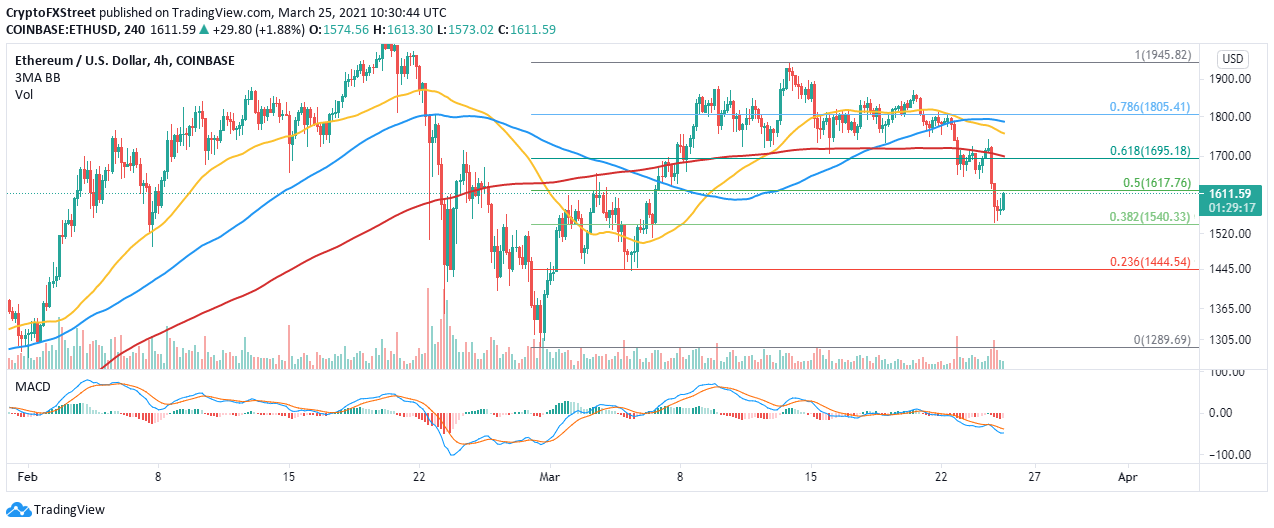
ETH/USD 4-hour chart
An exchange outflow metric is a useful tool when gauging the level and trend of accumulation of the token. It tracks the Ether tokens withdrawn from known exchange wallets on a daily basis. According to Santiment, this metric excludes exchange to exchange transactions.
The chart below shows a spike in Ethereum exchange outflows. It is worth noting that spikes suggest that investors prefer to hold as opposed to selling while anticipating the price to shoot upward. Therefore, ETH is most likely to increase the momentum toward the coveted $2,000 level.
%20[13.45.30,%2025%20Mar,%202021]-637522695305881044.png)
Ethereum exchange outflow chart
Looking at the other side of the picture
IntoTheBlock’s IOMAP chart predicts that Ethereum may face intense resistance between $1,751 and $1,799. Here, 1.18 million addresses had previously bundled up roughly 13.7 million ETH. It would be difficult for the bulls to slice through this zone while heading to $2,000.
-637522695483696485.png)
Ethereum IOMAP chart
Ethereum is dealing with weakening support levels on the downside, as illustrated by the model. In other words, massive losses will come into the picture in case of a correction from the prevailing market price.
However, the IOMAP brings attention to the region running from $1,557 to $1,504. Here, nearly 566,000 addresses had previously bought about 1.9 million ETH. Therefore, losses could extend further if this buyer congestion zone is broken.
Author

John Isige
FXStreet
John Isige is a seasoned cryptocurrency journalist and markets analyst committed to delivering high-quality, actionable insights tailored to traders, investors, and crypto enthusiasts. He enjoys deep dives into emerging Web3 tren


