Ethereum Price Prediction: ETH bulls gather strength for a sustained break above $4000


  • Ethereum bulls take a breather after Saturday’s $500 rally to record highs.
  • The No. 2 coin eyes additional upside after rising wedge breakout on the 4H chart.
  • RSI is in the overbought region, dip buying to keep the uptrend intact.

ETH/USD is off the fresh all-time highs of $3,984, holding on to the record run, as the bulls take a breather before the next push higher.

The renewed bearish sentiment across the crypto board seemingly checks the upside in the ETH price just as Bitcoin faces rejection once again near $60,000.

ETH/USD: In consolidation before the next upswing restarts

Ethereum’s four-hour chart shows that the price is holding the higher ground, consolidating the massive $500 increase seen on Saturday.

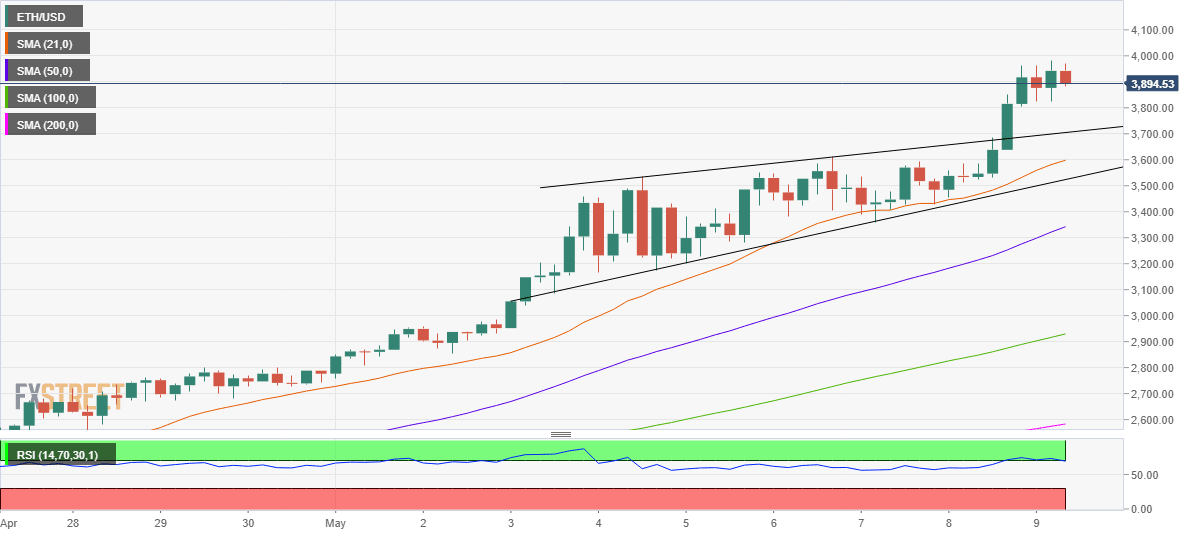
ETH/USD: Four-hour chart

The ETH bulls went onto clinch fresh record highs earlier on, although lacked additional vigor, as the relative strength index (RSI) peeped into the overbought territory.

The overbought conditions, however, are not overstretched, suggesting that there is likely more room to rally for the ETH price.

Therefore, the price could race past the $4000 barrier on a sustained basis, in order to reach the rising wedge pattern target at $4220.

Note that Ethereum confirmed a rising wedge upside break on the said time frame during American mid-morning on Saturday.

Despite the technical setup offering an upbeat outlook, the buyers could be wary of creating fresh positions after the recent upsurge, which could trigger a fresh pullback in the rates towards the pattern resistance now support at $3705.

A failure to defend that level could expose the bullish 21-simple moving average (SMA) at $3,598.

If the downside pressure intensifies and the initial pattern support at $3517 caves in, it could invalidate the rising wedge breakout, calling for a reversal of the uptrend in the near term.

ETH/USD: Additional levels to watch

ETH/USD

Overview
Today last price 3879.90
Today Daily Change -37.65
Today Daily Change % -0.96
Today daily open 3917.26
 
Trends
Daily SMA20 2832.55
Daily SMA50 2332.31
Daily SMA100 2012.91
Daily SMA200 1363.91
 
Levels
Previous Daily High 3962.44
Previous Daily Low 3455
Previous Weekly High 3610.91
Previous Weekly Low 2855.29
Previous Monthly High 2800
Previous Monthly Low 1886.11
Daily Fibonacci 38.2% 3768.6
Daily Fibonacci 61.8% 3648.84
Daily Pivot Point S1 3594.03
Daily Pivot Point S2 3270.79
Daily Pivot Point S3 3086.59
Daily Pivot Point R1 4101.47
Daily Pivot Point R2 4285.67
Daily Pivot Point R3 4608.91


Information on these pages contains forward-looking statements that involve risks and uncertainties. Markets and instruments profiled on this page are for informational purposes only and should not in any way come across as a recommendation to buy or sell in these assets. You should do your own thorough research before making any investment decisions. FXStreet does not in any way guarantee that this information is free from mistakes, errors, or material misstatements. It also does not guarantee that this information is of a timely nature. Investing in Open Markets involves a great deal of risk, including the loss of all or a portion of your investment, as well as emotional distress. All risks, losses and costs associated with investing, including total loss of principal, are your responsibility. The views and opinions expressed in this article are those of the authors and do not necessarily reflect the official policy or position of FXStreet nor its advertisers. The author will not be held responsible for information that is found at the end of links posted on this page.

If not otherwise explicitly mentioned in the body of the article, at the time of writing, the author has no position in any stock mentioned in this article and no business relationship with any company mentioned. The author has not received compensation for writing this article, other than from FXStreet.

FXStreet and the author do not provide personalized recommendations. The author makes no representations as to the accuracy, completeness, or suitability of this information. FXStreet and the author will not be liable for any errors, omissions or any losses, injuries or damages arising from this information and its display or use. Errors and omissions excepted.

The author and FXStreet are not registered investment advisors and nothing in this article is intended to be investment advice.

Join Telegram

Recommended content


Recommended Content

Editors’ Picks

Crypto Today: Bitcoin crumbles under German government transfers, Ethereum and Ripple erase gains

Crypto Today: Bitcoin crumbles under German government transfers, Ethereum and Ripple erase gains

Bitcoin trades below $57,100 on Thursday as German government transfers continue, $76 million BTC moved to exchanges. Ethereum trades near $3,100 ahead of the upcoming SEC decision on the Spot Ethereum ETF. 

More Cryptocurrencies News

Ripple traders take over $75 million in losses in July, XRP drops below key support

Ripple traders take over $75 million in losses in July, XRP drops below key support

Ripple (XRP) price is under fresh selling pressure and tests key support at the June 7 low of $0.4508 on Thursday as whales are likely capitulating, according to on-chain data.

More Ripple News

Bitcoin price declines as supply on exchanges rises

Bitcoin price declines as supply on exchanges rises

Bitcoin faced rejection at the daily resistance level of $63,956 on Monday, resulting in a 4.2% decline over the next two days. BTC’s price extends its downward move and falls below $58,000 on Thursday, adding more than 4% losses in the day. 

More Bitcoin News

Worldcoin is poised for 17% rally as as technical indicators signal bullish momentum

Worldcoin is poised for 17% rally as as technical indicators signal bullish momentum

Worldcoin price finds support and bounces 9% from the weekly support level around $2.183. Technical analysis shows that WLD has formed a bullish divergence on a momentum indicator.

More Worldcoin News

Bitcoin: BTC price correction could end in July, according to seasonal data

Bitcoin: BTC price correction could end in July, according to seasonal data

Bitcoin (BTC) price appears poised for a decline this week, influenced by slight outflows in US spot ETFs, selling activity among BTC miners, and a combined transfer of 4,690.28 BTC to centralized exchanges by the US and German governments.

Read full analysis

BTC

ETH

XRP