- ETH buyers contemplating the next move higher.
- $1400 remains in sight so long as 21-SMA on 4H chart holds.
- Overbought conditions on 1D chart point to a brief bullish consolidation
ETH/USD seemingly lacks a clear directional bias while trading around $1200 so far this Saturday, having staged a strong bounce from Friday’s deep correction to sub-$1100 levels.
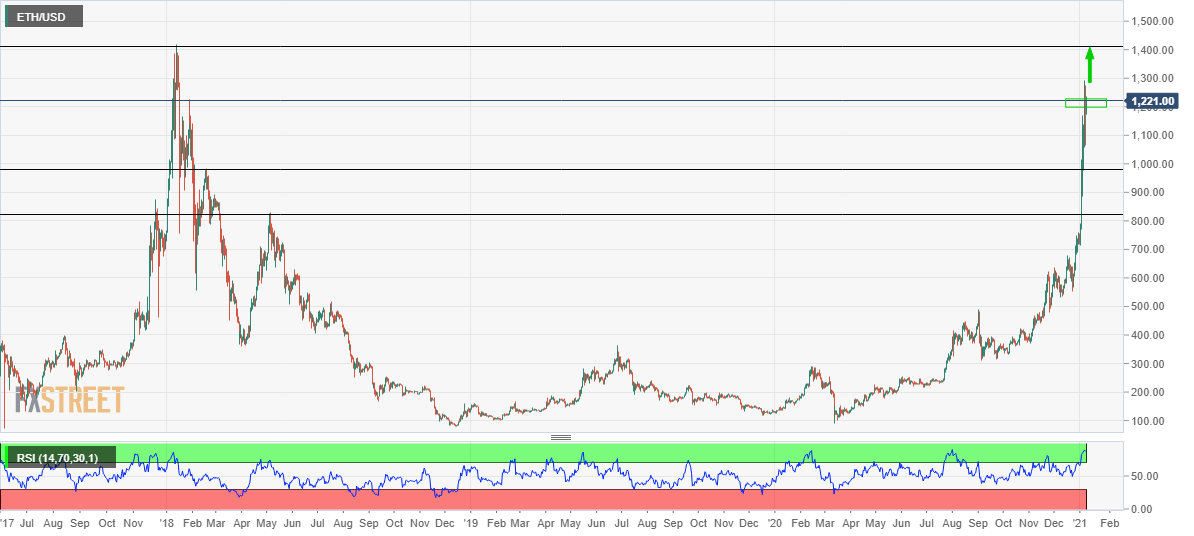
ETH/USD: Daily chart
As observed in the daily chart, Ethereum has additional room to the upside, with eyes set on the January 14 2018 high at $1419.
However, doji candlesticks formed for the third day in a row have left the buyers unnerved. Further, the 14-day Relative Strength Index (RSI) holds in the overbought region, around 88.0, flashing caution for the bulls.
Therefore, the price could enter a period of consolidation around the current levels before the buyers gear up for re-entry. At the moment, there seems to be strong demand around the $12K mark.
Friday’s low of $1063 could be put to test if the corrective pressure mounts.
-637457855949214244.png)
ETH/USD: Four-hour chart
Narrowing down to the four-hour chart structure, the further upside appears more compelling, as the no. 2 coin has once again managed to defend the critical 21-simple moving average (SMA), which is currently placed at $1194.
It’s worth noting that the price has not closed the candle below the 21-SMA since January 2 2021.
ETH/USD wavers within a potential rising wedge pattern. A breach of the abovementioned crucial support could expose the rising trendline support at $1139, below which Friday’s low remains in sight.
However, a run up towards the rising trendline resistance at $1348 and beyond looks likely, as the RSI points north above the midline, now standing firmer at 59.80.
ETH/USD: Additional levels to watch
Information on these pages contains forward-looking statements that involve risks and uncertainties. Markets and instruments profiled on this page are for informational purposes only and should not in any way come across as a recommendation to buy or sell in these assets. You should do your own thorough research before making any investment decisions. FXStreet does not in any way guarantee that this information is free from mistakes, errors, or material misstatements. It also does not guarantee that this information is of a timely nature. Investing in Open Markets involves a great deal of risk, including the loss of all or a portion of your investment, as well as emotional distress. All risks, losses and costs associated with investing, including total loss of principal, are your responsibility. The views and opinions expressed in this article are those of the authors and do not necessarily reflect the official policy or position of FXStreet nor its advertisers. The author will not be held responsible for information that is found at the end of links posted on this page.
If not otherwise explicitly mentioned in the body of the article, at the time of writing, the author has no position in any stock mentioned in this article and no business relationship with any company mentioned. The author has not received compensation for writing this article, other than from FXStreet.
FXStreet and the author do not provide personalized recommendations. The author makes no representations as to the accuracy, completeness, or suitability of this information. FXStreet and the author will not be liable for any errors, omissions or any losses, injuries or damages arising from this information and its display or use. Errors and omissions excepted.
The author and FXStreet are not registered investment advisors and nothing in this article is intended to be investment advice.
Recommended Content
Editors’ Picks
Ripple update: XRP shows resilience in recent crypto market sell-off
Ripple's XRP is up 6% on Tuesday following a series of on-chain metrics, which reveals investors in the remittance-based token held onto their assets despite the wider crypto market sell-off last week.
Floki DAO floats liquidity provisioning for a Floki ETP in Europe
Floki DAO — the organization that manages the memecoin Floki — has proposed allocating a portion of its treasury to an asset manager in a bid to launch an exchange-traded product (ETP) in Europe, allowing institutional investors to gain exposure to the memecoin.

Six Bitcoin mutual funds to debut in Israel next week: Report
Six mutual funds tracking the price of bitcoin (BTC) will debut in Israel next week after the Israel Securities Authority (ISA) granted permission for the products, Calcalist reported on Wednesday.

Crypto Today: BTC hits new Trump-era low as Chainlink, HBAR and AAVE lead market recovery
The global cryptocurrency market cap shrank by $500 billion after the Federal Reserve's hawkish statements on December 17. Amid the market crash, Bitcoin price declined 7.2% last week, recording its first weekly timeframe loss since Donald Trump’s re-election.

Bitcoin: 2025 outlook brightens on expectations of US pro-crypto policy
Bitcoin price has surged more than 140% in 2024, reaching the $100K milestone in early December. The rally was driven by the launch of Bitcoin Spot ETFs in January and the reduced supply following the fourth halving event in April.

Best Forex Brokers with Low Spreads
VERIFIED Low spreads are crucial for reducing trading costs. Explore top Forex brokers offering competitive spreads and high leverage. Compare options for EUR/USD, GBP/USD, USD/JPY, and Gold.