Ethereum Price Prediction: Assessing ETH’s potential breakout
- Ethereum price consolidates in a rectangle pattern ahead of a potentially massive breakout.
- Holders with tokens between 1,000 and 10,000 remain skeptical of a bullish move.
- The choppy market is set to continue until Ethereum price escapes the rectangle channel.

Ethereum price trends sideways between an upper range limit at $1,380 and a lower range limit at $1,272. Its recent rejection caught most investors unawares, with ETH falling to trade at $1,330 at the time of writing. Support at $1,300 remains crucial to the Ethereum price recovery going into the weekend. Otherwise, its lower range limit will be tested or even broken.
Ethereum price breakout seems imminent
The rectangle pattern on the four-hour chart paints an undetermined technical picture of Ethereum price. In other words, the price is bounded by parallel support and resistance zones, exhibiting an extended consolidation period.
It is worth mentioning that rectangle patterns do not have a bullish or bearish bias. Traders should remember that a breakout could take any direction – either upside or downside.
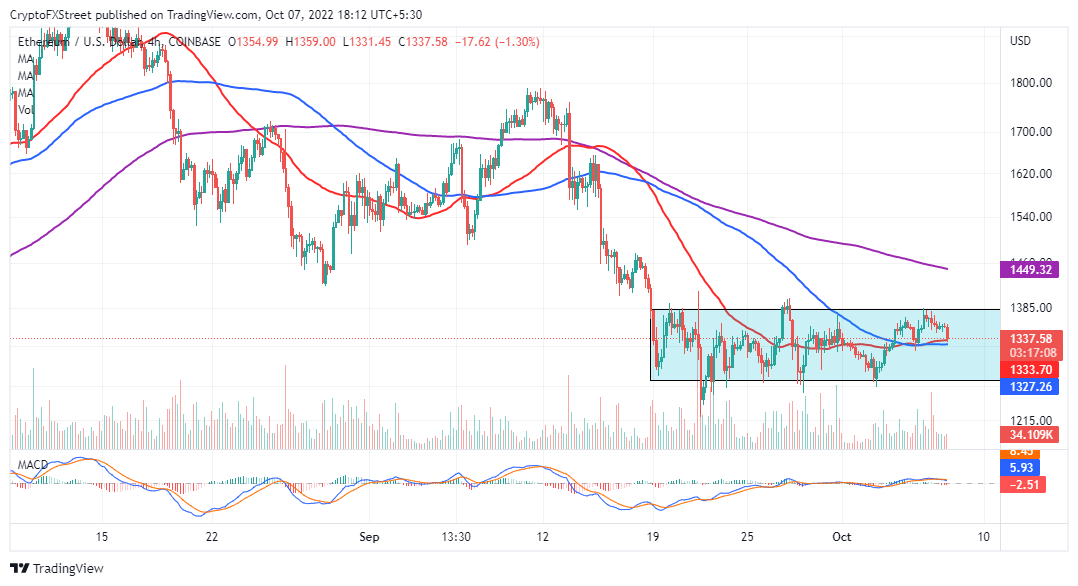
ETH/USD four-hour chart
Ethereum price may explore areas below the pattern to continue with the direction of the trend preceding the consolidation. Besides, the MACD (Moving Average Convergence Divergence (MACD) has just presented a sell signal on the same chart. If bears heed the call, pressure will mount on ETH with a possibility of a downside breakout.
The 50-day SMA (Simple Moving Average), red and the 100-day SMA, blue, are offering bulls some relief. Ethereum price must stay above these moving averages to wrestle out of the bearish tightening grip.
Are whales squeezing the life out of Ethereum price?
Since the Merge on September 15, large volume holders of ETH have not slowed down their selling activities. The Supply Distribution chart below reveals a 2.40% drop from 5,634 to 5,499 addresses. As whales sell Ethereum, the pressure snuffs out any bullish sparks – resulting in more declines. Hence, a downside breakout from the rectangle that could see ETH price slide below $1,000, is not so farfetched.
 [15.47.13, 07 Oct, 2022]-638007479026501343.png)
Ethereum Supply Distribution
Ethereum price’s range consolidation will continue if insight from the IOMAP on-chain metric by IntoTheBlock is considered. An immense resistance is expected at $1,397, where approximately 288,800 addresses bought 5.18 million ETH tokens. Breaking above this level would not be easy because investors may prefer to sell at breakeven points, creating overhead pressure.
-638007478304169744.png)
Ethereum IOMAP model
Conversely, robust support sits at $1,317, where 1.22 million addresses purchased 4.95 million ETH tokens. Ethereum price has a higher chance of staying above this zone because investors who bought at that level will be rooting for a move to the upside.
Author

John Isige
FXStreet
John Isige is a seasoned cryptocurrency journalist and markets analyst committed to delivering high-quality, actionable insights tailored to traders, investors, and crypto enthusiasts. He enjoys deep dives into emerging Web3 tren


