Ethereum price must crack this key level before exploding toward $6,400
- Ethereum price has presented a buying opportunity with a targeted move of 60%.
- However, ETH is met with a tough resistance at $3,961, near the psychological level at $4,000 that has been a major headwind for the coin.
- Ethereum price may discover strong support at $3,465 if a spike in selling pressure emerges.

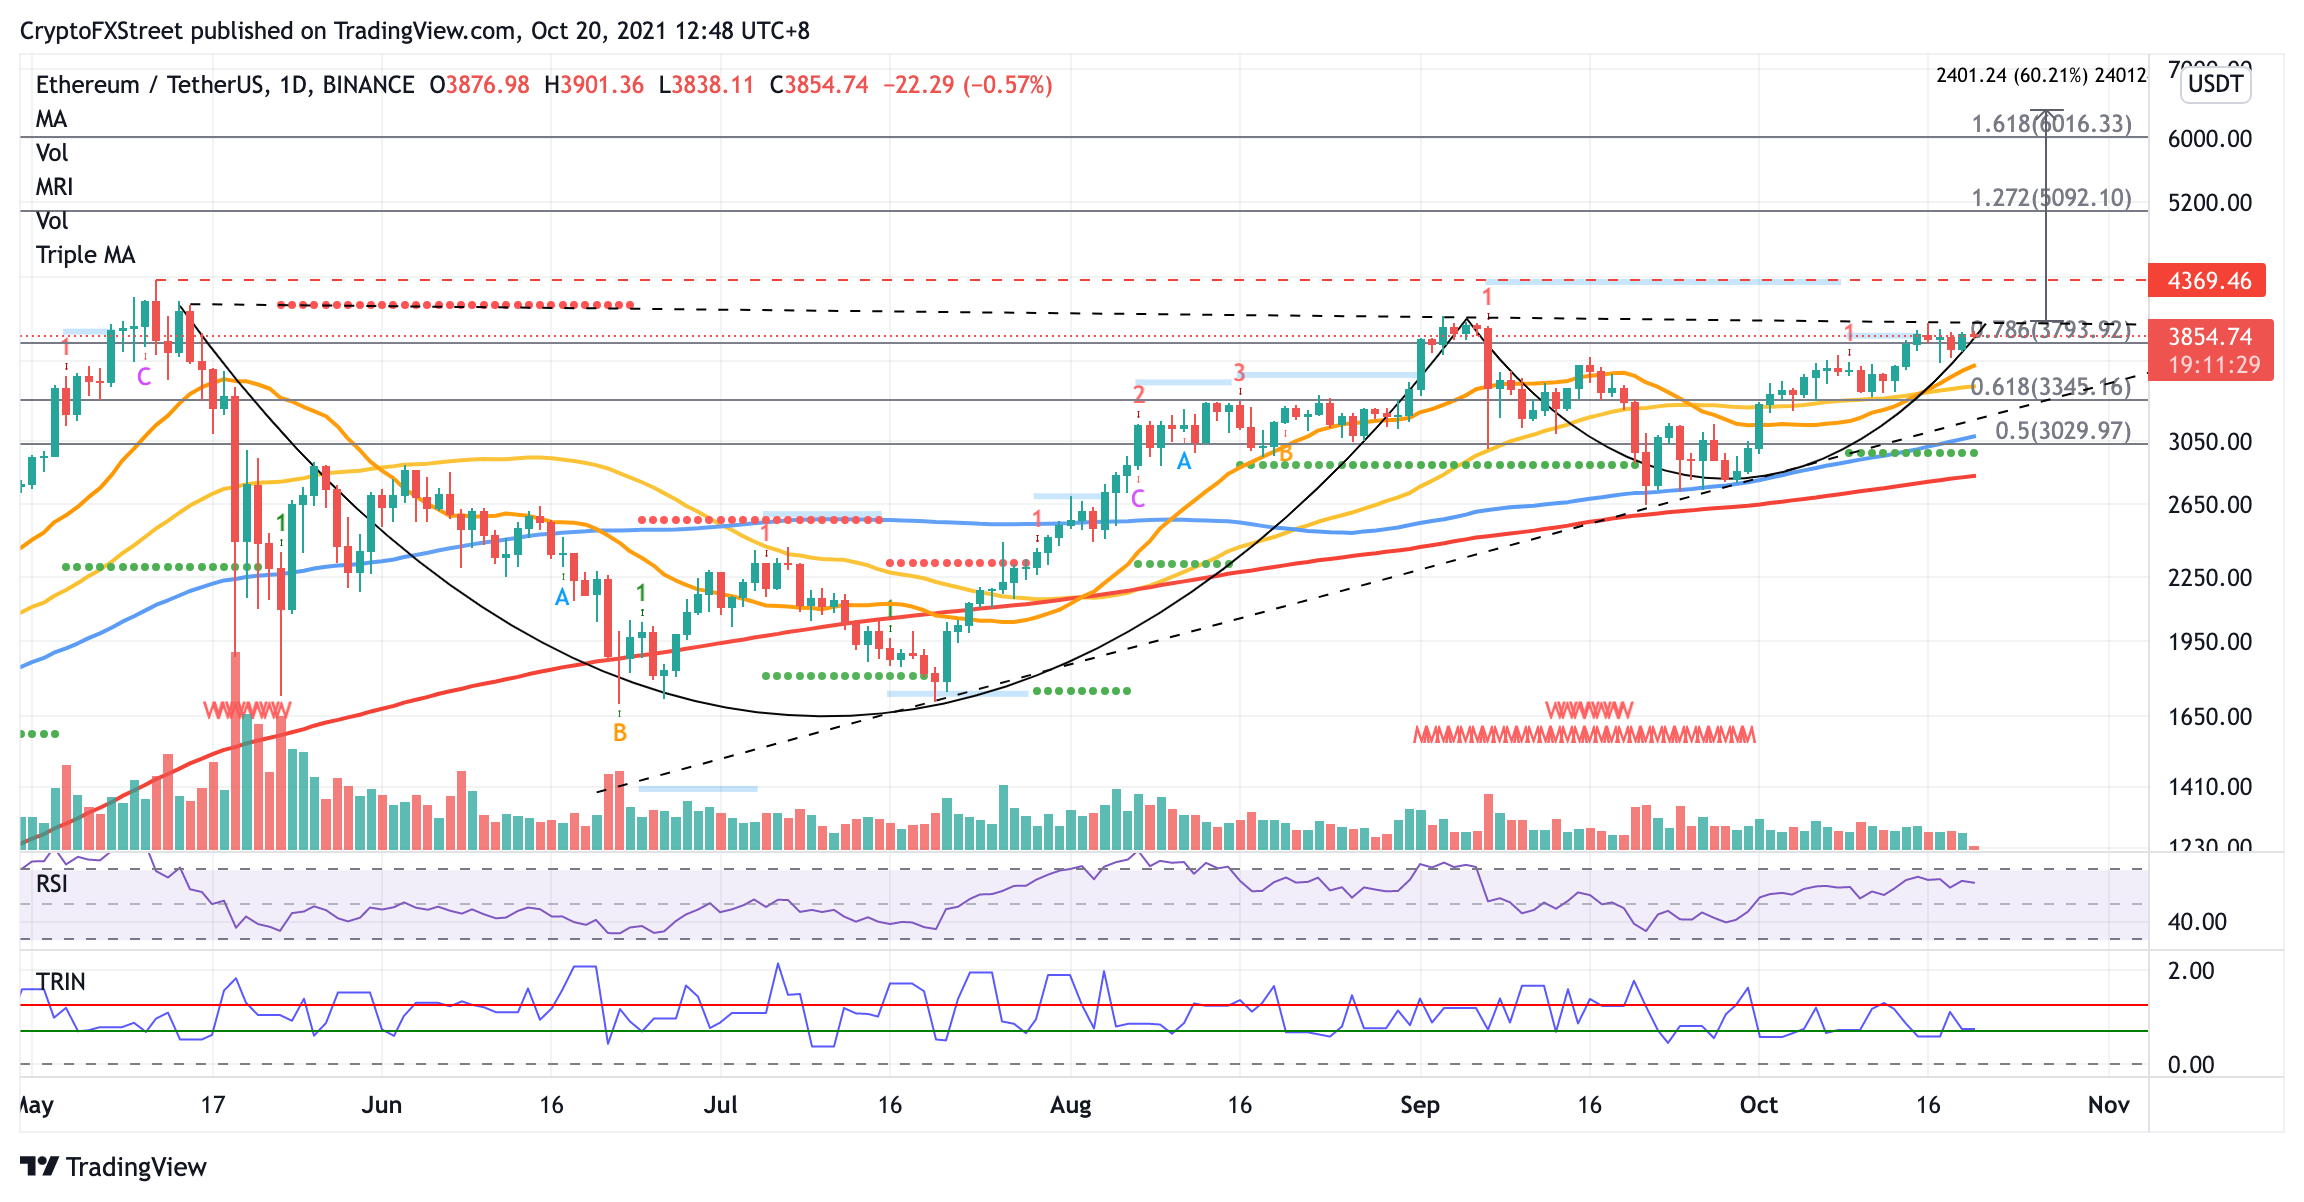
Ethereum price has presented a massive bullish target on the daily chart, suggesting that ETH is preparing for a rally toward $6,400. However, there is one key resistance level to slice through before the token is propelled higher into price discovery territory.
Ethereum price ready to enter into price discovery
Ethereum price has formed a cup-and-handle pattern on the daily chart, indicating that ETH is anticipating a major bullish move higher. By measuring the depth of the cup, the prevailing chart pattern suggests a 60% climb toward $6,394.
To capitalize on the Ethereum price rally, the bulls should target a slice above the handle’s top at $3,961, coinciding with the multi-month resistance trend line that formed since May 12. Investors should take note that only a break above this price point would see ETH rally 60%.
At the same time, adding credence to the bullish outlook is the ascending triangle pattern that also is established on the daily chart. This is formed by connecting the aforementioned five-month resistance trend line and the ascending trend line that formed since July 20.
The Arms Index (TRIN), which gauges overall market sentiment, further suggests that there are more buyers in the market than sellers, confirming accelerating interest in the asset.
The psychological $4,000 level acts as a stiff obstacle for Ethereum price. Only a committed move higher accompanied by a substantial increase in buying pressure could push ETH higher into price discovery, above its all-time high price at $4,360.
ETH/USDT daily chart
There are still a few resistances ahead before Ethereum price is headed for the aforementioned bullish target. The 127.2% Fibonacci extension level and 161.8% Fibonacci extension levels act as major hurdles for ETH at $5,092 and $6,016, respectively.
However, if the bulls fail to dominate the market, Ethereum price would discover immediate support at the 20-day Simple Moving Average (SMA) at $3,622, then at the 50-day SMA at $3,465. According to IntotheBlock’s In/Out of Money Around Price (IOMAP), this level acts as the most significant support level for the token if it moves to the downside, as 1.63 million addresses purchased over 11 million ETH at an average price of $3,465.
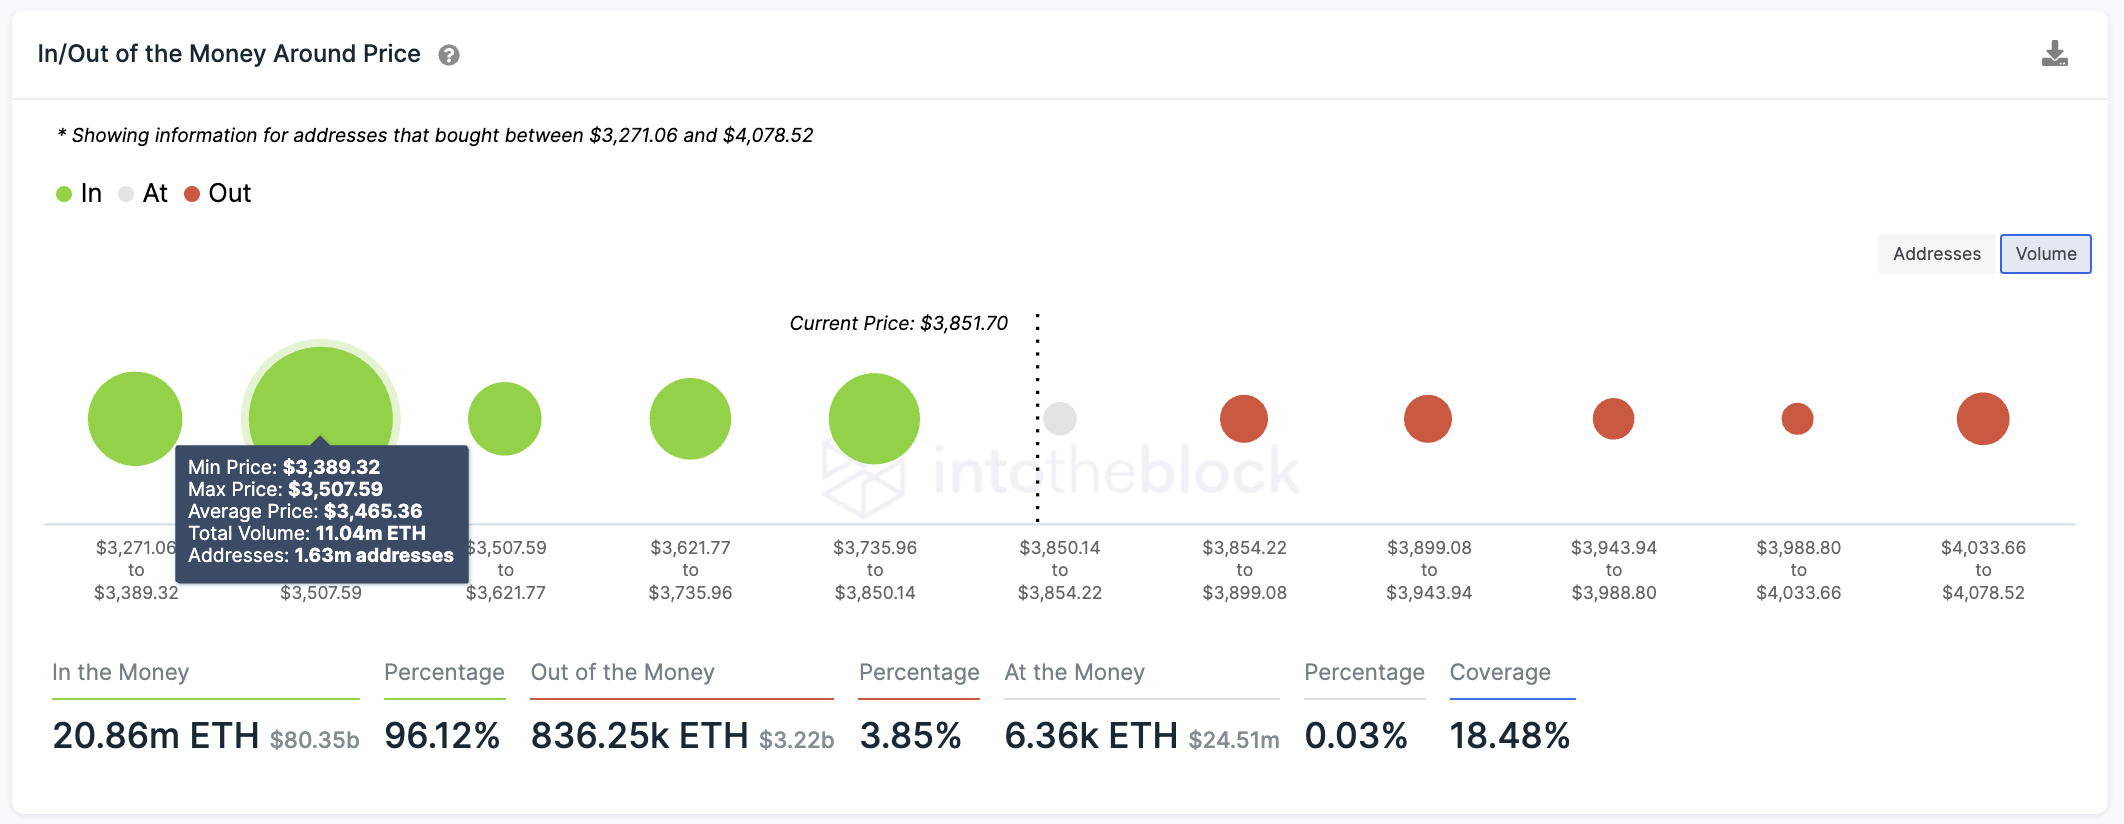
ETH IOMAP
An additional foothold may appear at the 61.8% Fibonacci retracement level at $3,345 before dropping toward the ascending support trend line at $3,276. Lower prices are not expected unless a sudden surge in sell orders materializes.
Author

Sarah Tran
Independent Analyst
Sarah has closely followed the growth of blockchain technology and its adoption since 2016.


