Ethereum price may drop 12% before it reaches $1,300
- Ethereum price climbed the charts to trade at $1,250 after a 3.4% rise on Wednesday.
- If Ethereum flips the resistance of $1,263 into support, it would be able to push higher to tag $1,306 and register a 10% rally.
- Should bearishness take command, Ethereum would be forced to defend $1,148, losing which would invalidate the bullish thesis.

Ethereum price has been performing far better in comparison to other altcoins despite correcting significantly during the FTX crash. The cryptocurrency is still maintaining its macro uptrend, which is crucial for ETH to recover its losses.
Furthermore, Ethereum price, along with the broader market, could also be impacted by the December 2022 Nonfarm Payrolls. Economists are expecting the United States jobs report to report about 200,000 job gains for the last month of 2022.
However, should the US Bureau of Labor Statistics report higher figures as they did in September 2022, Ethereum and other cryptocurrencies' prices could dip due to a decline in demand. If not, Ethereum price is most likely to follow the broader market cues.
Etheruem price takes a breather
Ethereum price could be seen trading at $1,250 at the time of writing as the second-generation cryptocurrency made some recovery this week. After being rangebound between $1,233 and $1,187 for almost two weeks, ETH broke out this week, setting its eyes on reclaiming $1,300.
In order to do so, the Ethereum price would need to continue its bullish run induced by the buyers. This would allow ETH to breach its immediate resistance at $1,263 and push toward the critical resistance level at $1,306. From there on, the altcoin king would need to tag $1,370 in order to initiate recovery for losses suffered in November last year.
However, it could face some sideways movement over the next few days as the market is overheated at the moment. The Relative Strength Index (RSI) currently highlights that the market is cooling down at the moment. The presence of the indicator in the overbought zone (beyond 70.0) is usually followed by corrections or undeviating movement in the prices.
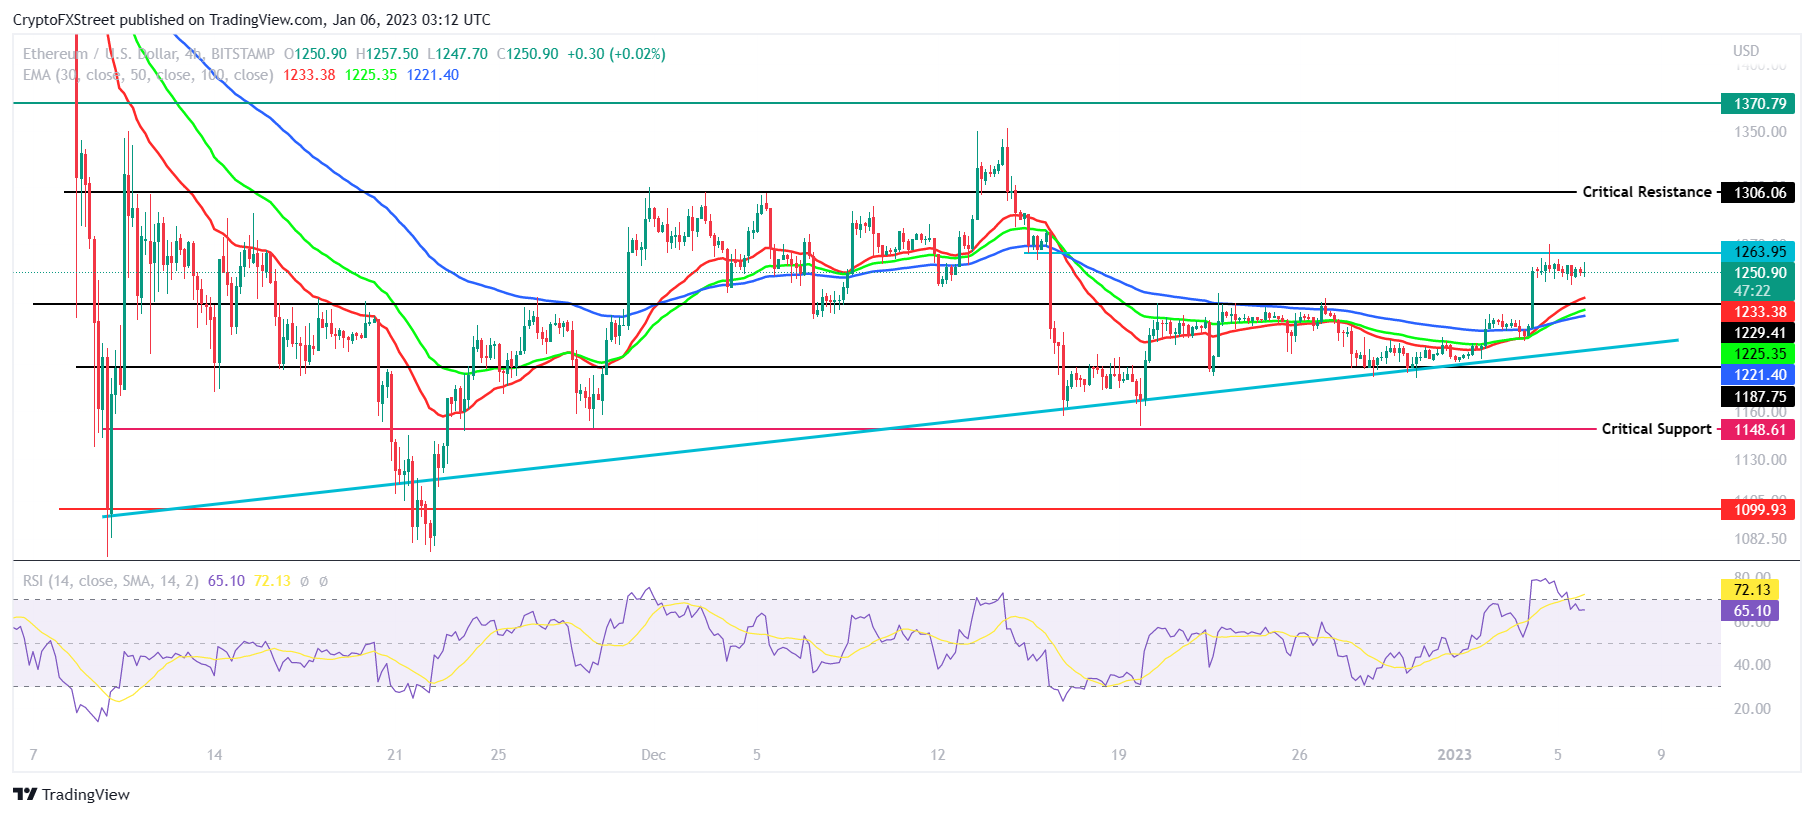
ETH/USD 4-hour chart
Although, at the moment, the former will not be the case because the cryptocurrency also has the support of the 30-, 50- and 100-day Exponential Moving Averages (EMA).
If the Ethereum price were to lose these EMA supports, it would still have multiple support levels to fall back on. But if ETH falls through $1,229 and $1,187, it would end up tagging the critical support at $1,148. A daily candlestick close below this level would invalidate the bullish thesis, resulting in the altcoin king falling to the lows of $1,099, registering a 12% decline.
Author

Aaryamann Shrivastava
FXStreet
Aaryamann Shrivastava is a Cryptocurrency journalist and market analyst with over 1,000 articles under his name. Graduated with an Honours in Journalism, he has been part of the crypto industry for more than a year now.


