Ethereum price may bounce 20%, as ETH strikes pivotal support
- Ethereum price reaches key support range as daily candlestick begins to shape a doji pattern, potentially signaling a reversal.
- Daily Relative Strength Index (RSI) still has not registered an oversold reading on a daily close, suggesting more ETH weakness.
- 61.8% Fibonacci retracement level at $1,730 being tested for the second time since May.

Ethereum price, like most altcoins, has fallen below the May 23 panic low as selling pressure gripped the cryptocurrency complex yesterday and earlier today. ETH now rests on the convergence of the 200-day simple moving average (SMA) and the anchored volume-weighted price (anchored VWAP), taking the form of a doji candlestick pattern. The current standoff expressed by the doji pattern may mark a reversal and an actionable low for skillful traders.
Ethereum price shows bulls are active at current levels, but bears are not hibernating yet
The positive response of Ethereum price to the notable support framed by the 200-day SMA at $1,878, the anchored VWAP at $1,847, the 2020 rising trend line at $1,793, the 61.8% retracement of the March 2020-May 2021 rally at $1,730 and the May 23 low of $1,728 creates a hint of optimism for eager ETH investors and speculators.
Adding some comfort is the potential doji pattern being defined on the daily chart, showing indecision on the side of both ETH sellers and buyers. It could also be interpreted as a reversal or the beginning of a consolidation range. Nevertheless, the doji pattern communicates that the early selling pressure was matched with spirited buying as the day has progressed.
The Ethereum price bounce is a marked improvement for the smart contracts giant, but it does not confirm that a sustainable low has been printed. Still, it may present a high probability opportunity for agile traders to initiate pilot buys with a target around the February high of $2,041, a crucial level of support during the April and May periods of ETH weakness.
Important upside resistance includes the 50% retracement of the March 2020-May 2021 rally at $2,237, representing an 18% return from the current price. If today’s low is sustainable, Ethereum price could target the symmetrical triangle’s lower trend line around $2,550, delivering a 35% gain from the current price.
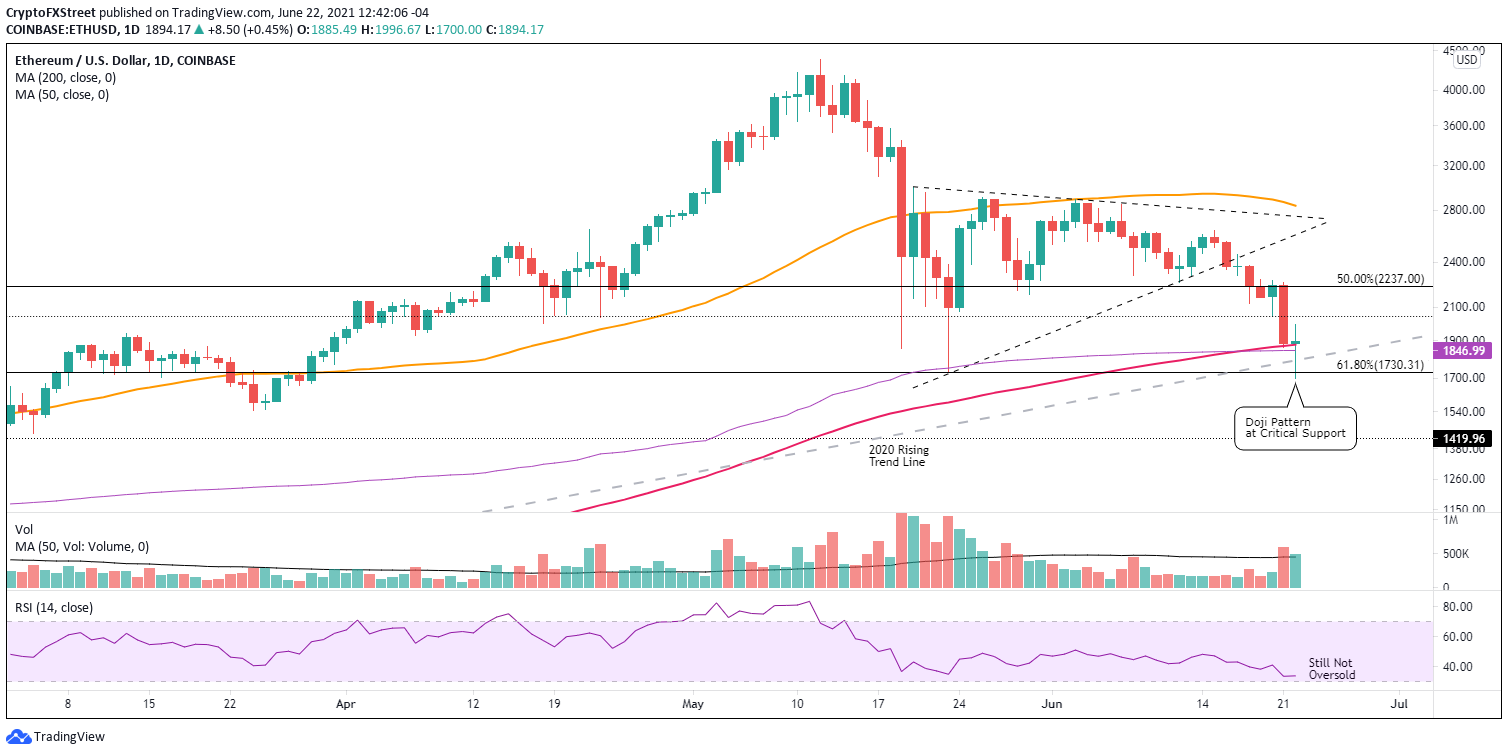
ETH/USD daily chart
A daily close below the May 23 low of $1,728 would confirm that the current ETH selling has not been exhausted, and Ethereum price may fall to the 2018 high of $1,419, thereby ensuring an oversold condition on the daily RSI.
It is important to note that Ethereum price did draw a symmetrical triangle before breaking down on June 16. The measured move of the triangle pattern is approximately 43%, leaving ETH just below the 2018 high at $1,372.
Author

Sheldon McIntyre, CMT
Independent Analyst
Sheldon has 24 years of investment experience holding various positions in companies based in the United States and Chile. His core competencies include BRIC and G-10 equity markets, swing and position trading and technical analysis.


