Ethereum price holds above $3K but network data suggests bulls may get trapped

ETH price just broke from a long-term descending channel, but on-chain data still points to a few bearish catalysts.
When analyzing Ether's (ETH) price chart, one could conclude that the 3-month long bearish trend has been broken for a few reasons. The current $3,100 price range represents a 43% recovery in 15 days and, more importantly, the descending channel resistance was ruptured on Feb. 7.
Should Ether bulls start celebrating and calling for $4,000 and higher? That largely depends on how retail traders are positioned, along with the Ethereum network's on-chain metrics. For instance, is the $30-plus transaction fee impacting the use of decentralized applications (dApps), or are there any other factors that will prohibit Ether's price growth?
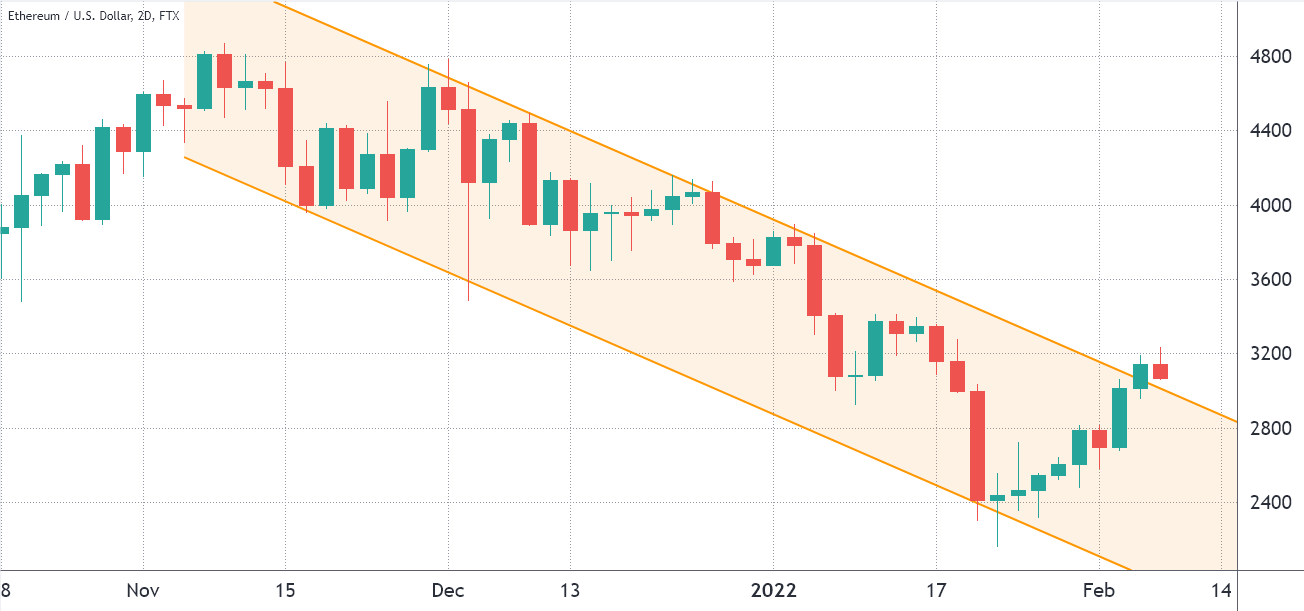
Ether (ETH) price at FTX, in USD. Source: TradingView
Since the 55.6% correction from the $4,870 all-time high to the cycle bottom at $2,160 on Jan. 24, Bitcoin (BTC) has failed to break the $45,500 resistance and traders concluded that a 12% correction was the most likely scenario.
On a brighter note, on Feb. 7, Big Four auditor KPMG's Canadian wing announced the addition of Bitcoin and Ether to its corporate treasury. The decision reflects KPMG Canada's belief that cryptocurrencies are a "maturing asset class," according to Benjie Thomas, a managing partner for the firm.
Derivatives data tells a different story
To understand how confident traders are about Ether's price recovery, one should analyze the perpetual contracts futures data. This instrument is the retail traders' preferred market because its price tends to track the regular spot markets.
In any futures contract trade, longs (buyers) and shorts (sellers) are matched at all times, but their use of leverage varies. Consequently, exchanges will charge a funding rate to whichever side demands more leverage, and this fee is paid to the opposing side.
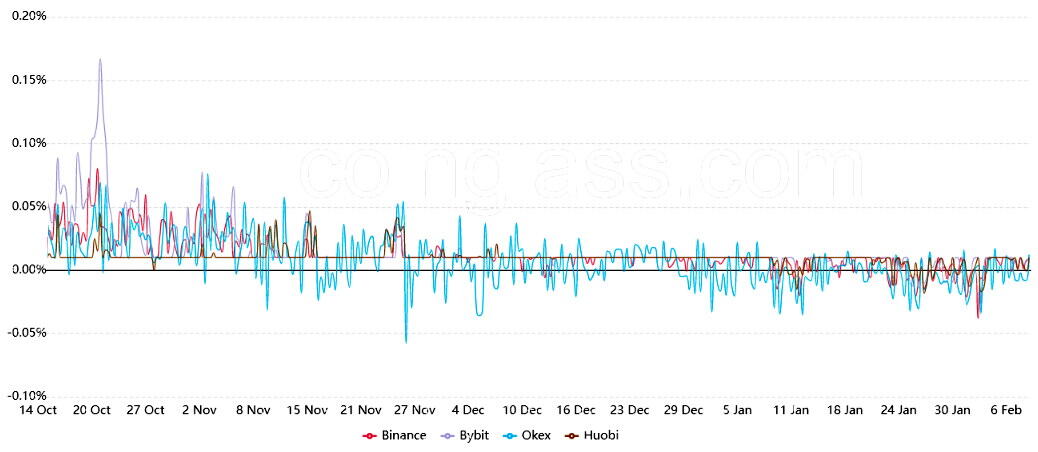
Ether perpetual futures 8-hour funding rate. Source: Coinglass
This indicator will tell us whether retail traders are getting excited, which would cause it to move above 0.05%, equivalent to 1% per week. Notice how the past couple of months showed a slightly negative funding rate, reflecting the bearish sentiment. Currently, there is no sign that retail traders are confident enough to reopen leveraged long positions.
One should analyze the Ethereum network's on-chain data to understand if the lack of confidence is specific to leverage trading. For example, even though there is no set relation between Ether's price and network use, low transaction volume and a decline in active users could be a concern if decoupled from a price hike.
On-chain metrics raise concern
Measuring the monetary value of the ETH transacted on the network provides a reliable indicator of effective use. Of course, this metric could be masqueraded by increasing adoption in layer-2 solutions but it remains a starting point.
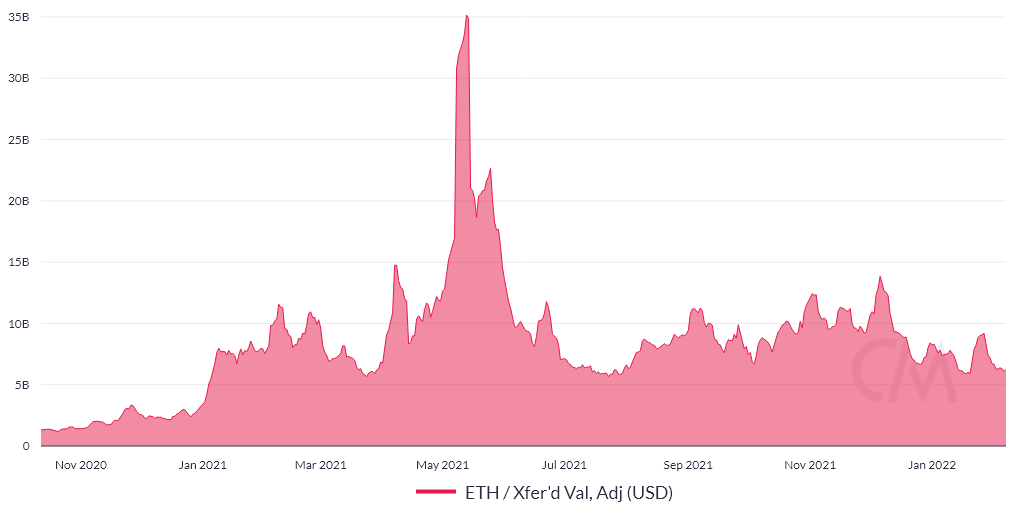
Sum of native token units transferred per day. Source: CoinMetrics
The current $6.2 billion daily transaction average is a 55% drop from December's peak and not really far from the 1-year low at $5.6 billion. Thus, it is safe to conclude that Ether token use is not showing signs of growth, at least on the primary layer.
Analysts should also check decentralized applications usage metrics. One must remember that the Total Value Locked (TVL) is heavily concentrated on lending platforms and decentralized exchanges (DEX). Consequently, gauging the number of active addresses provides a broader view.
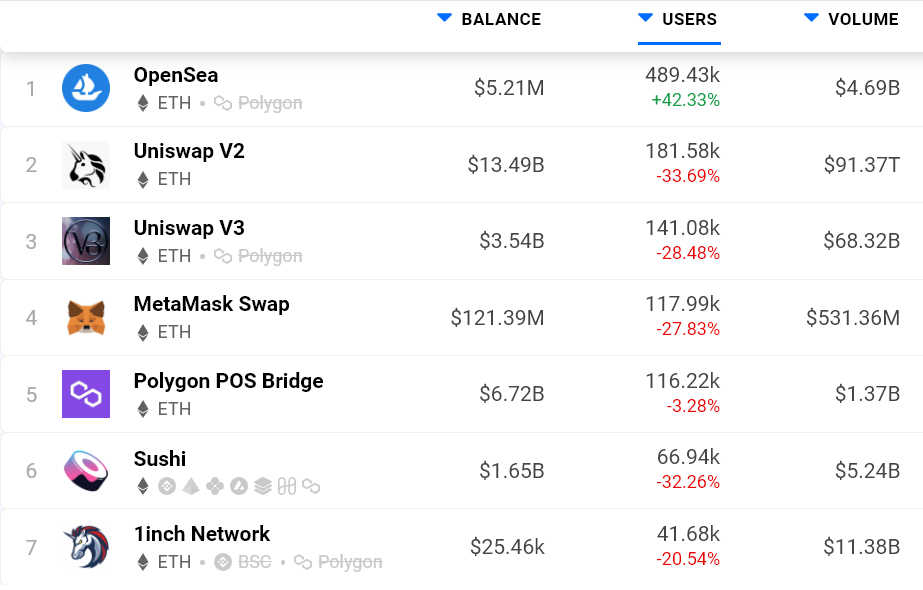
Ethereum network 30-day dApps activity. Source: DappRadar
Apart from the non-fungible token (NFT) marketplace Opensea, Ethereum dApps saw a monthly 28% decrease in the number of active addresses. In a nutshell, that is disappointing usage data because the smart contract network was specifically designed to host decentralized applications.
Unless there's an uptick in Ether transactions and dApps usage metrics, investors will interpret any Ether price move above $3,000 as a potential bull trap. As for retail traders' neutral funding rate, it might as well be a bullish sign that the investor class typically enters long leverage positions after a strong rally.
Author

Cointelegraph Team
Cointelegraph
We are privileged enough to work with the best and brightest in Bitcoin.


