- Ethereum price hovers below a monthly resistance level of $1,677 after multiple rejections.
- Transaction data and whale movements suggest a local top has already formed and that the trend reversal is underway.
- A daily candlestick close that flips the monthly hurdle at $1,677 into a support floor will invalidate the bearish thesis for ETH.
Ethereum price shows multiple signs that this uptrend has lost its steam. There is clear power struggle between the bulls and bears, which has led to a tight consolidation. But odds seem to be favoring the sellers.
Ethereum price needs to decide its next move
Ethereum price chart looks simple and indicates that a rejection at the monthly hurdle of $1,677 will lead to a correction to the $1,329 support level. But a flip of the said level could trigger a rally for ETH.
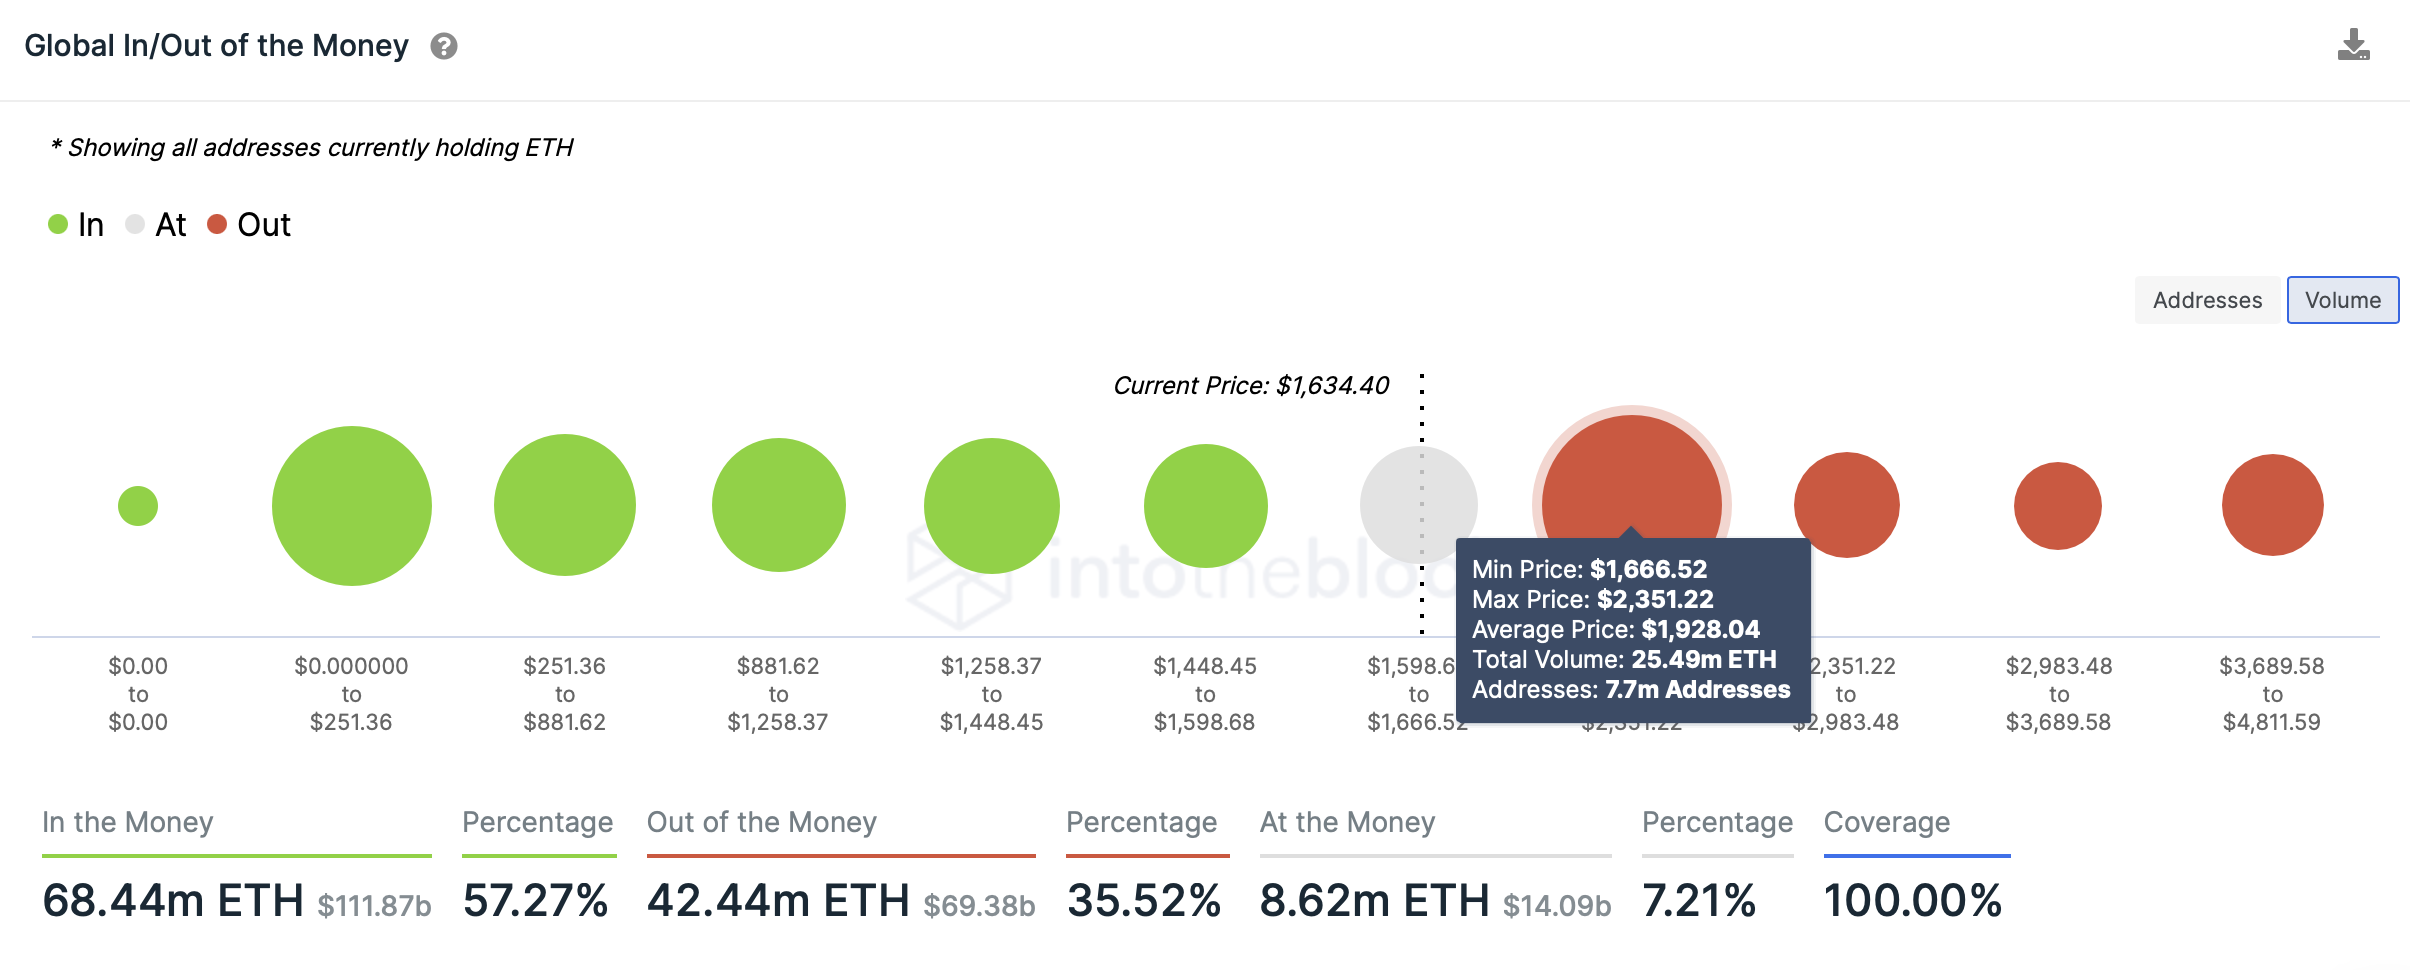
While the price chart remains the same, certain sell signals are developing, as seen in the on-chain metrics. IntoTheBlock’s Global In/Out of the Money (GIOM) reveals a massive cluster of investors at $1,928. Here roughly 7.7 million addresses that purchased 25.5 million ETH are “Out of the Money.”
These investors bought their ETH between $1,666 and $2,351 and are likely to sell their holdings as ETH enters their buy zone. This move would add weight to the selling pressure triggering a liquidation of the longs.
Hence, a move into the $2,000 psychological level seems highly unlikely, at least until Bitcoin price recovers.
ETH GIOM
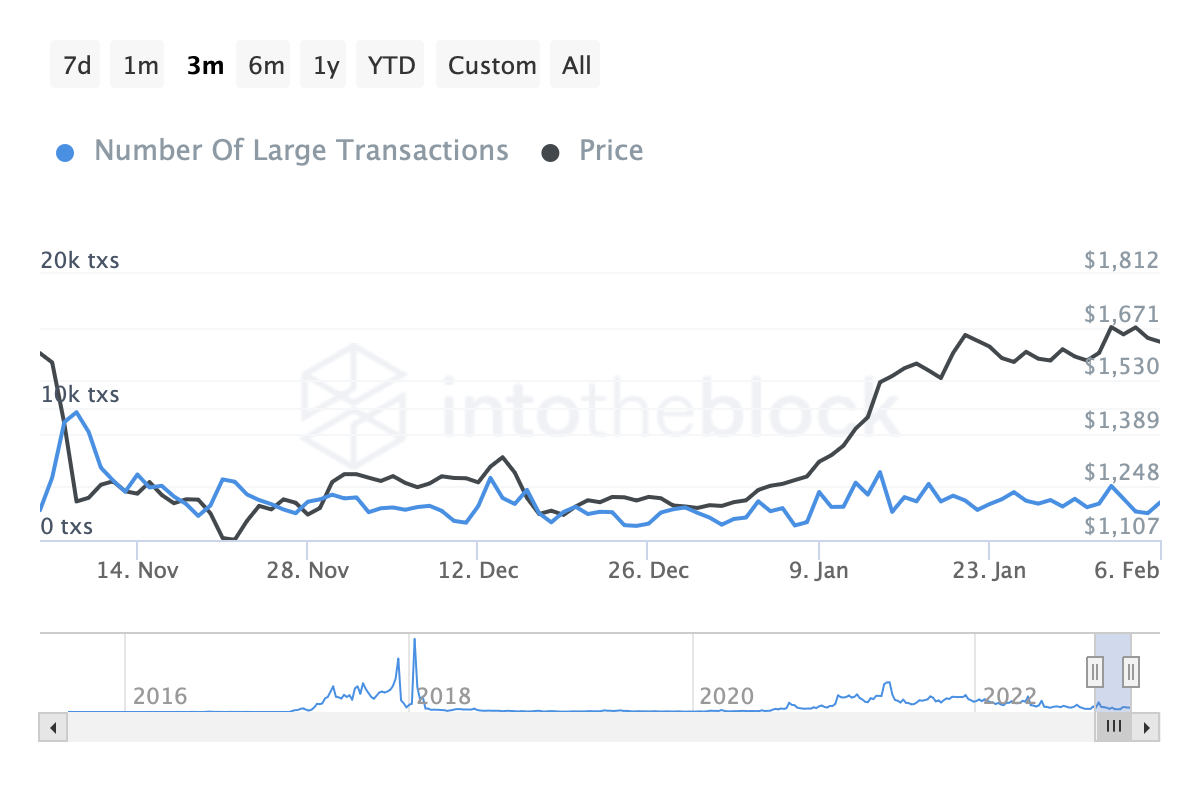
Further adding credence to this outlook is the large transactions worth $100,000 or more on the ETH network. This metric is used as a proxy to the number of whales or institutional investors interacting with the Ethereum network.
Typically, a sharp increase in large transactions after a rally indicates these whales could be moving their holdings to book profits. Hence, upticks in this metric can be used to predict local top formations.
As for Ethereum, the large transactions have spiked from 2,020 to 4,070, denoting a roughly 100% surge in whales’ interaction with the Ethereum network and potential for local top formation.
ETH large transactions
Adding these two outlooks to the fact that Bitcoin price is also forming a potential top will provide a more succinct picture of the market conditions. Therefore, investors need to be cautious.
On the other hand, a flip of the $1,677 monthly hurdle into a support floor will confirm that the bulls are back. In such a case, Ethereum price could attempt to retest the immediate hurdles at $1,779, $1,820 and the $2,000 psychological level.
Information on these pages contains forward-looking statements that involve risks and uncertainties. Markets and instruments profiled on this page are for informational purposes only and should not in any way come across as a recommendation to buy or sell in these assets. You should do your own thorough research before making any investment decisions. FXStreet does not in any way guarantee that this information is free from mistakes, errors, or material misstatements. It also does not guarantee that this information is of a timely nature. Investing in Open Markets involves a great deal of risk, including the loss of all or a portion of your investment, as well as emotional distress. All risks, losses and costs associated with investing, including total loss of principal, are your responsibility. The views and opinions expressed in this article are those of the authors and do not necessarily reflect the official policy or position of FXStreet nor its advertisers. The author will not be held responsible for information that is found at the end of links posted on this page.
If not otherwise explicitly mentioned in the body of the article, at the time of writing, the author has no position in any stock mentioned in this article and no business relationship with any company mentioned. The author has not received compensation for writing this article, other than from FXStreet.
FXStreet and the author do not provide personalized recommendations. The author makes no representations as to the accuracy, completeness, or suitability of this information. FXStreet and the author will not be liable for any errors, omissions or any losses, injuries or damages arising from this information and its display or use. Errors and omissions excepted.
The author and FXStreet are not registered investment advisors and nothing in this article is intended to be investment advice.
Recommended Content
Editors’ Picks

White House Crypto Summit could boost adoption across financial markets: Binance exec Rachel Conlan
Trump’s White House Crypto Summit is hours away, and executives maintain optimism and a positive outlook on crypto adoption. Rachel Conlan of Binance expects increased institutional and retail participation.

Bitcoin Weekly Forecast: Will Trump's Strategic Bitcoin Reserve and White House Crypto Summit support BTC recovery?
Bitcoin (BTC) remains under pressure and continues its decline, trading around $88,900 at the time of writing on Friday and falling over 5% this week.

Solana’s co-founder says ‘No Reserve’ to SOL as a part of Trump’s Crypto Strategic Reserve
Solana price stabilizes and trades around $142.8 at the time of writing on Friday after falling nearly 20% this week. Solana co-founder Anatoly Yakovenko raised concern about SOL as part of the US Crypto Strategic Reserve on his social media X.

BTC, ETH and XRP struggle despite Trump’s Bitcoin Reserve order
Bitcoin price is extending its decline on Friday after falling more than 7% so far this week. Ethereum price is retesting its key support level at around $2,125; a close below would extend the correction.
Bitcoin: Will Trump's Strategic Bitcoin Reserve and White House Crypto Summit support BTC recovery?
Bitcoin (BTC) remains under pressure and continues its decline, trading around $88,900 at the time of writing on Friday and falling over 5% this week.

The Best brokers to trade EUR/USD
SPONSORED Discover the top brokers for trading EUR/USD in 2025. Our list features brokers with competitive spreads, fast execution, and powerful platforms. Whether you're a beginner or an expert, find the right partner to navigate the dynamic Forex market.