![]() Sarah Tran
Sarah Tran
Independent Analyst
- Ethereum price continues to recover after over half of its gains have been wiped out from the May market crash.
- ETH appears to be trading within an ascending triangle, setting up a price structure that could indicate a 30% price surge.
- The bullish thesis could only be unraveled if the cryptocurrency is able to sustain above the 50 twelve-hour moving average and manages to break above $2,936.
Ethereum price has continued to make higher lows since its massive crash that sent the cryptocurrency to a swing low of $1,732, wiping out 60% of its gains. Although ETH is still in recovery, the current price structure indicates that Ethereum is ready for a breakout.
Ethereum price primed to breakout
Ethereum price has reclaimed almost 50% of its losses from its deep plunge under $2,000 on May 23. Speculation looms of ETH showing signs of capitulation as the network has seen a spike in exchange inflow.
According to behavioral analytics firm Santiment, it is not uncommon for large inflows of tokens sent to exchanges preceding rapid price growth.
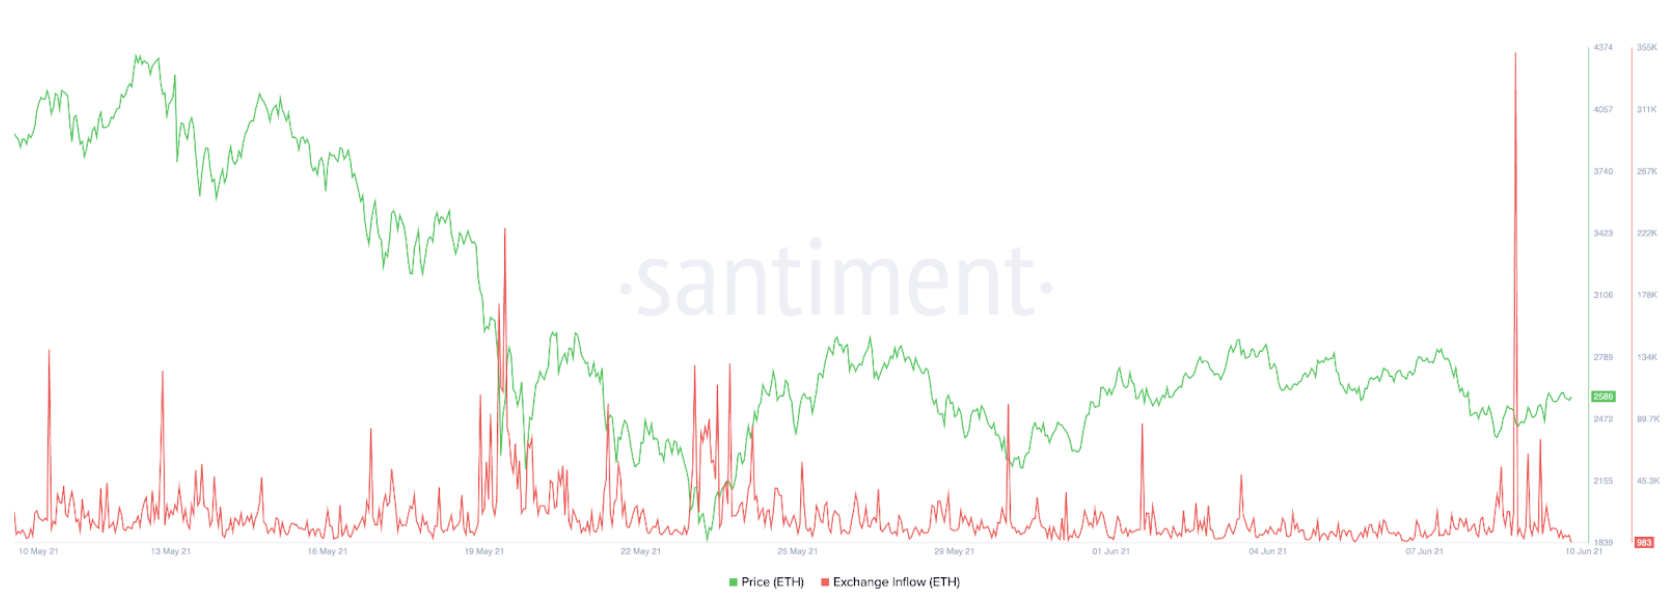
ETH exchange inflow
On the 12-hour chart, ETH appears to be forming an ascending triangle, forming a horizontal trend line drawn along the swing highs, and a rising trend line established by connecting the swing lows.
Ascending triangles are considered to be a bullish formation that usually indicates accumulation. As the pattern develops, the volume contracts until a potential breakout occurs.
The upside target of the pattern is calculated by measuring the widest distance of the pattern and adding it to the horizontal trend line. The measured move of a potential breakout for ETH is 30%, reaching $3,810. This Ethereum price point coincides with the 78.6% Fibonacci extension level, adding credence to the bullish thesis.
The Bollinger Bands squeeze could also indicate that Ethereum is anticipating a large price move.
Now, the 50 twelve-hour moving average acts as critical resistance for ETH, and a break above this level could galvanize investors’ interest, adding fuel for a potential rally. Failure to sustain above this price point could shift Ethereum price action to continue trading sideways.
ETH bulls must also wait for an escape above the horizontal trend line at $2,936, and a spike in volume before a rally to the upside can be confirmed.
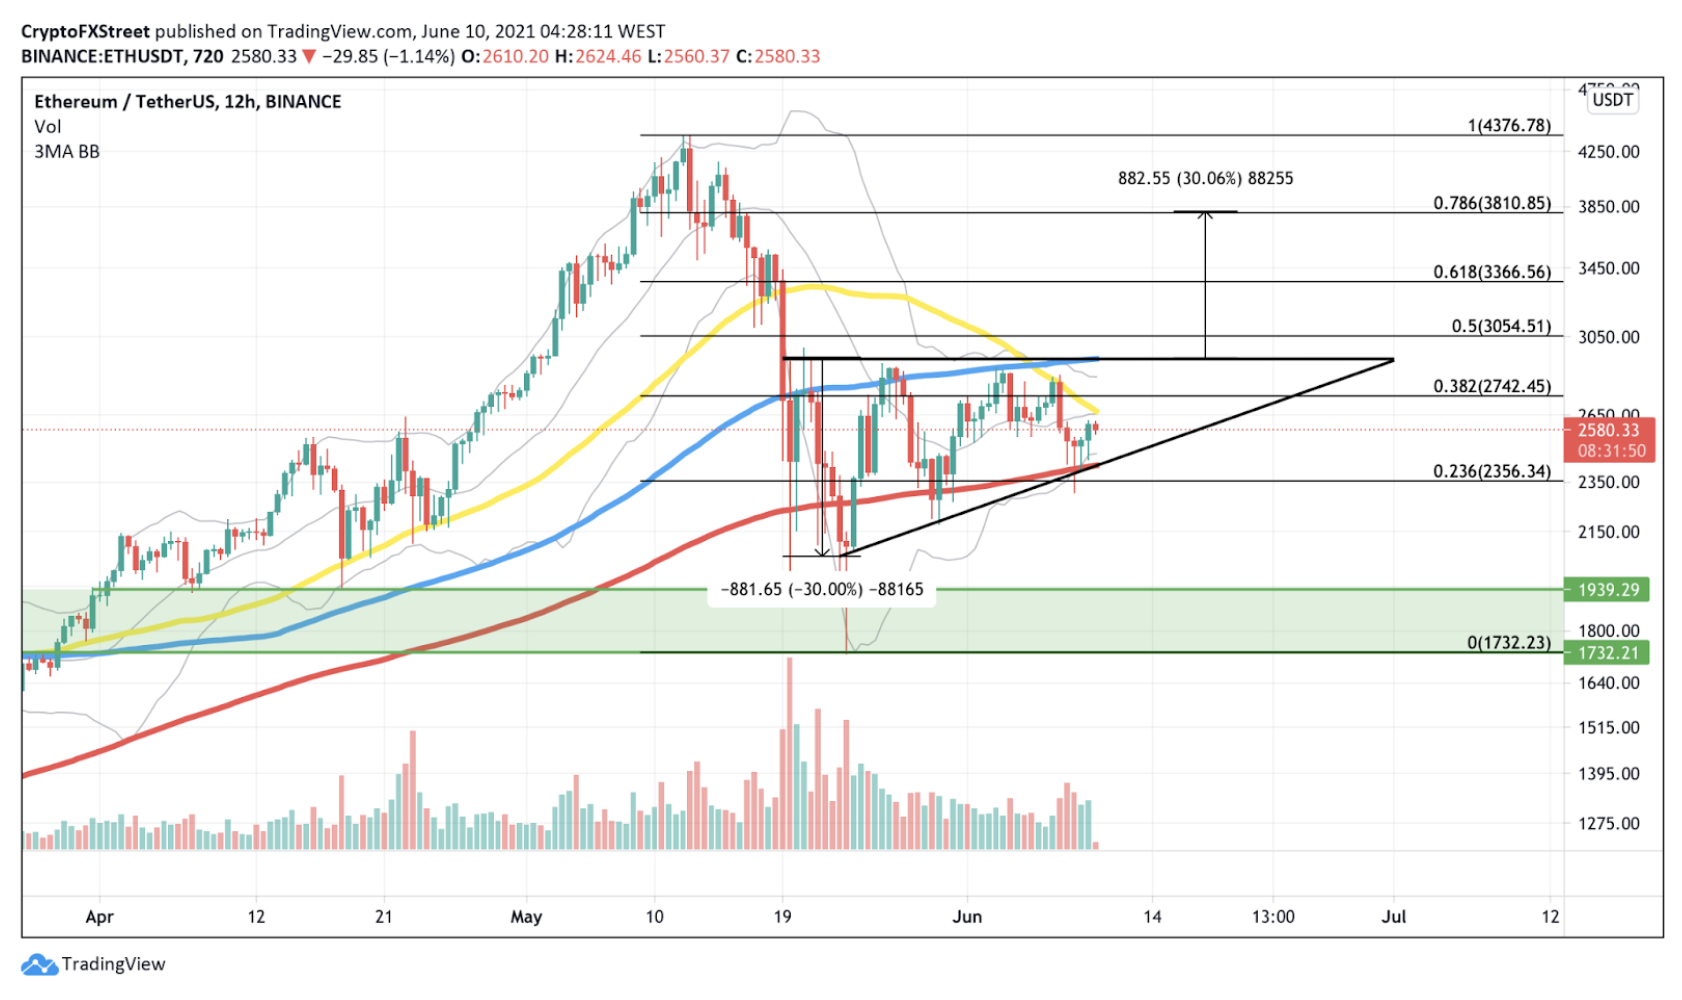
ETH/USDT 12-hour chart
Speculators must take note of the 200 twelve-hour moving average as this level is currently acting as critical support for ETH, as it correlates with the ascending trend line that forms the triangle. A break below this line of defense could see Ethereum free fall to below $2,000 once again, dipping to its demand barrier, ranging from $1,732 to $1,939.
Note: All information on this page is subject to change. The use of this website constitutes acceptance of our user agreement. Please read our privacy policy and legal disclaimer. Opinions expressed at FXstreet.com are those of the individual authors and do not necessarily represent the opinion of FXstreet.com or its management. Risk Disclosure: Trading foreign exchange on margin carries a high level of risk, and may not be suitable for all investors. The high degree of leverage can work against you as well as for you. Before deciding to invest in foreign exchange you should carefully consider your investment objectives, level of experience, and risk appetite. The possibility exists that you could sustain a loss of some or all of your initial investment and therefore you should not invest money that you cannot afford to lose. You should be aware of all the risks associated with foreign exchange trading, and seek advice from an independent financial advisor if you have any doubts.
Recommended Content
Editors’ Picks

PEPE Price Forecast: PEPE could rally to double digits if it breaks above its key resistance level
Pepe (PEPE) memecoin approaches its descending trendline, trading around $0.000007 on Tuesday; a breakout indicates a bullish move ahead.

Tron Price Prediction: Tether’s $1B move triggers TRX ahead of US Congress stablecoin bill review on Wednesday
Tron price defied the broader crypto market downtrend, surging 3% to $0.25 on Monday. This bullish momentum comes as stablecoin issuer Tether minted another $1 billion worth of USDT on the Tron network, according to on-chain data from Arkham.

Ethereum Price Forecast: Short-term holders spark $400 million in realized losses, staking flows surge
Ethereum (ETH) bounced off the $1,800 support on Monday following increased selling pressure from short-term holders (STHs) and tensions surrounding President Donald Trump's reciprocal tariff kick-off on April 2.

BlackRock CEO warns Bitcoin could replace US Dollar as global reserve currency, crypto ETFs witness inflows
BlackRock CEO Larry Fink stated in an annual letter to investors on Monday that the US national debt could cause the Dollar's global reserve status to be replaced with Bitcoin if investors begin to see the digital currency as a safer asset.

Bitcoin: BTC remains calm before a storm
Bitcoin's price has been consolidating between $85,000 and $88,000 this week. A K33 report explains how the markets are relatively calm and shaping up for volatility as traders absorb the tariff announcements. PlanB’s S2F model shows that Bitcoin looks extremely undervalued compared to Gold and the housing market.

The Best brokers to trade EUR/USD
SPONSORED Discover the top brokers for trading EUR/USD in 2025. Our list features brokers with competitive spreads, fast execution, and powerful platforms. Whether you're a beginner or an expert, find the right partner to navigate the dynamic Forex market.