- Longer-term Ethereum chart shows price action underpinned after dismal 2022 led by surging inflation.
- ETH seasonality shows June and September as the best time to buy.
- Ethereum price action should benefit from energetic efficiency after the Merge.
- Legal framework adoption shows acceptance of cryptocurrencies.
- CME Futures data points to equilibrium between buyers and sellers, while interest has never been that big before.
- All bits and pieces together added up point toward ETH price upside.
Ethereum (ETH) price action is about to close 2022 with a dismal performance of -65%, making it a year that investors will quickly want to forget. Key factors that triggered this sell-off included the strong US Dollar, which was the preferred safe haven in a year where geopolitical risks were elevated at a level not seen for several decades, and surging inflation numbers. It might have been even that specific element, inflation, the main reason why the market capitalization of several cryptocurrencies has been declining over the year.
Households worldwide saw food bills, rent and energy bills arising, eating out bigger chunks of their spending and making the portion of their disposable income for investments much smaller to even non-existing. At one point, investors even pulled out their investments and had to go into cash in order to make ends meet and pay for all the bills. With inflation abating a bit according to the last numbers and several central banks making it their mission to bring it back to manageable levels, 2023 could be the year for Ethereum to act as the come-back-kid.
Longer-term chart shows Ethereum price action underpinned
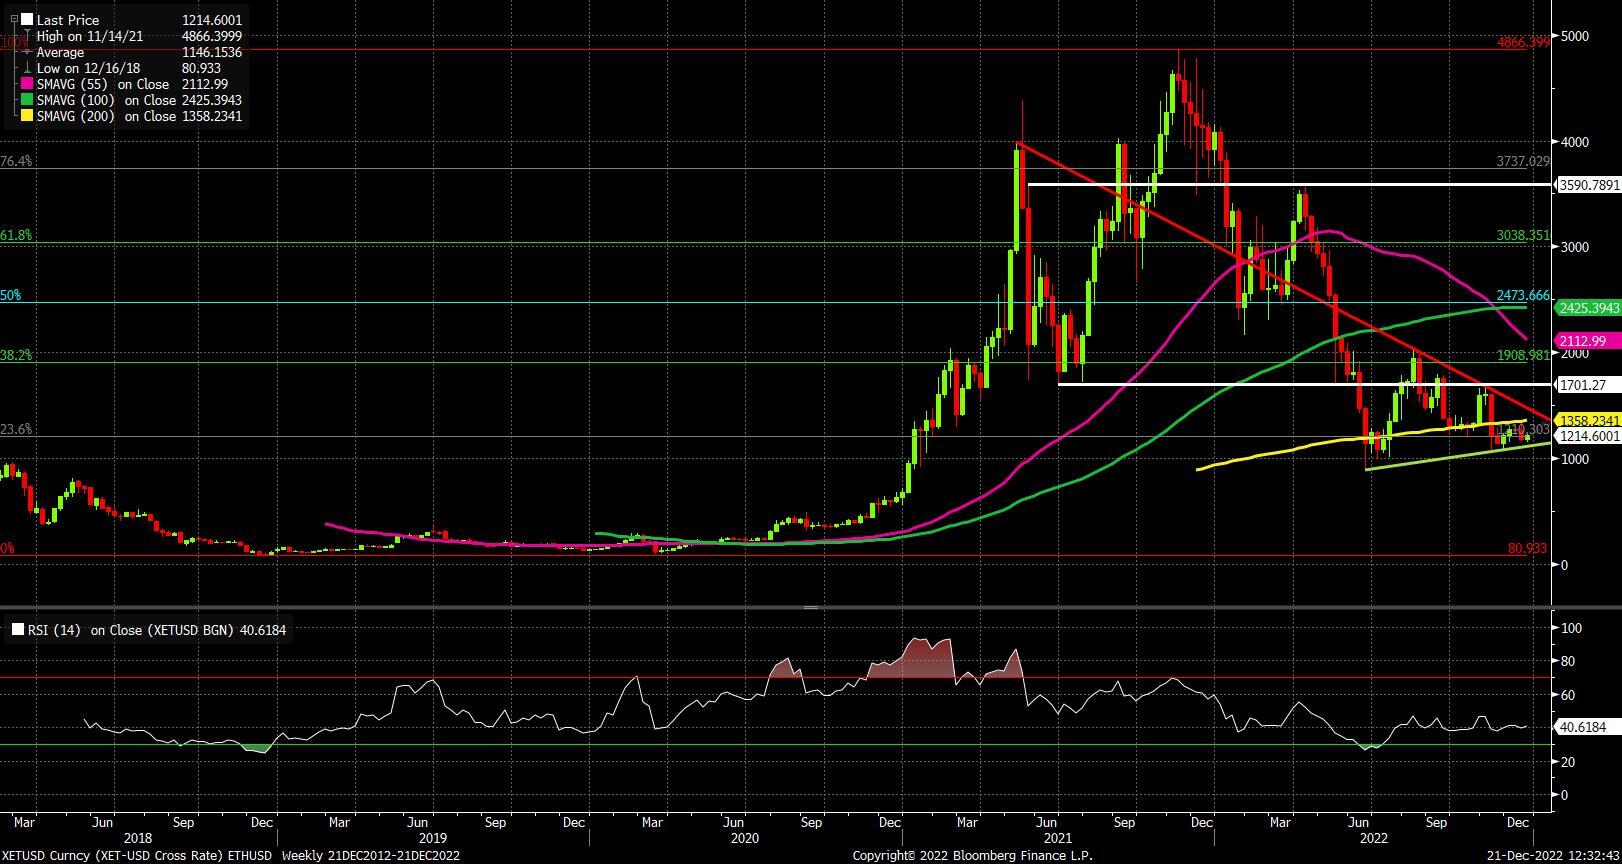
Ethereum price is seeing bulls trying to support price action, as they have been trying to do throughout the year. After November, a second point was identified where ETH bulls wanted price action to slide. With that low point confirmed, a third confirmation has revealed an ascending trend line coming from June 2022.
Ethereum currently trades nicely alongside that trend line (painted in green) and, going into the end of 2022, is looking to close above there, making it a very important supportive element. Expect heavy buying on that support level to the upside. From the downside, the red descending trend line is coming in from the peak of May 2021 and, along the way, has seen very solid respect throughout 2022.
This makes it a pennant formation nearing its breakout point in the first quarter of 2023. The Relative Strength Index (RSI) is still at the lower end of the spectrum, offering ample reason and upside potential for bulls to drive price action up. A potential breakout would first see a 45% rally toward $1,700, which should be a pivotal level in the future with a fade and some profit-taking. Should bulls be able to break that glass ceiling, the round $2,000 mark is up for grabs with a bull run to roughly $2,480 at the 50% Fibonacci level.
ETH/USD weekly chart
Ethereum seasonality shows two months are the best time to buy
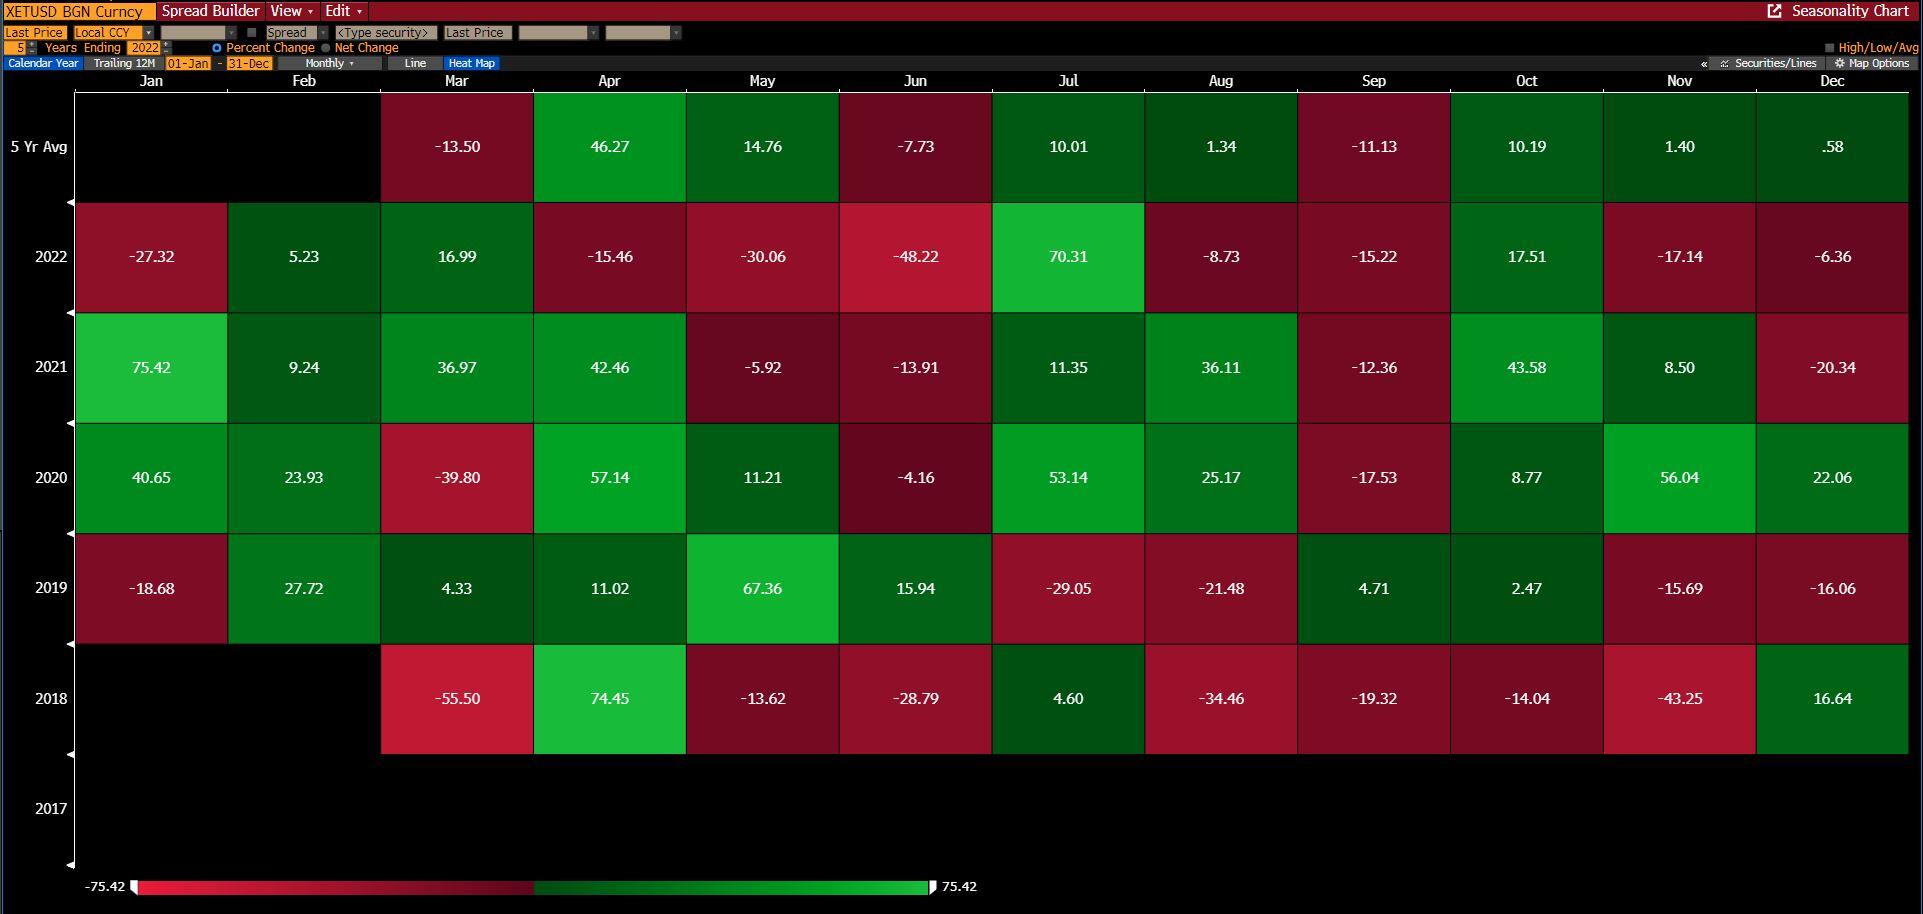
Ethereum price will not go in a straight line upwards or downwards for the year. To time the right moment in the year on when to buy, sell and sit on the positions, it pays off to look at the ETH seasonal chart since 2018. A few months can be retained on what to do and when.
ETH looks like a steal in September, June, and a smaller portion in March. These months have roughly performed the most negative in the five years on record, making those moments or dips the right moment to buy. Opposite are February, April and May, printing the best returns for bulls. A special remark for April that has returned on average a 46.27% of profit to the portfolios, with only 2022 as an exception.
ETH/USD heat map monthly performance
Life after the Merge
In 2022, Ethereum underwent an upgrade called ‘The Merge’ which unfortunately got overshadowed by the bigger macroeconomic and geopolitical events that were ongoing. To make matters even worse, crypto bears used it to seize control of the price action and run Ethereum price into the ground, with a 15% decline in September when stage ‘Bellatrix” got activated. Traders and investors overlooked what ‘The Merge’ stood for and wrote it off.
Instead, this huge technical upgrade got tangled up with the news of El Salvador embracing Bitcoin as its official currency, and the cryptocurrency markets tanked massively on the back of the downstream effects of several crypto industry malpractices, including the collapses of the Terra stablecoin, the Three Arrows Capital hedge fund and the most notably the FTX exchange .
For 2023, ‘The Merge’ should trigger some support and provide some low-hanging fruit for the Ethereum bulls. With the global push for Environmental, Social and Governance (ESG), more green transitions and energy consciousness, ‘The Merge’ is the perfect answer to the bad reputation cryptocurrencies such as Bitcoin have because its mining requires loads of electricity.
With Ethereum 2.0 and Ethermint, which brings together the Ethereum Virtual Machine and the Cosmos Software Development Kit, substantial savings are made up to 99.9% on Blockchain energy consumption. This labels Ethereum as one of the best cryptocurrencies making progress on this issue and should see it pay off in 2023.
When governments start to lay out frameworks both legal and on energy criteria, something that could take another step ahead in 2023, Ethereum could beat Bitcoin and even has the potential to become the biggest cryptocurrency to be accepted legally by governments.
Cryptocurrency regulation taking steps ahead
As already touched upon in the previous paragraph, legal adoption and frameworks about cryptocurrencies are being put into place and discussed by lawmakers and politicians. A big event that merits a mention happened in April 2022, when US Treasury Secretary Yellen came out in favor of cryptocurrencies by acknowledging that the sector was in transition, further nearing the needs of meeting with the US Department of Treasury.
Although other central banks are rather reluctant to adopt or support cryptocurrencies, the fact that both the European Central Bank (ECB) and the US Federal Reserve (Fed) are both building a digital currency shows that the road is being paved for a collaboration of some sort soon.
This could make Ethereum price see gaining upticks in volume and price action as more regular inflow gets generated. That should again underpin price action and see a more stable and logical price direction, better withstanding any big shockers still occurring. The transfer of capital from the US Dollar to Ethereum should go smoother once the framework has been laid out and the connection between the digital native currency and Ethereum has been made.
CME Futures data shows Ethereum trading volume has never been that big before
Another interesting element to add to this analysis for 2023 is to look at the behavior of contracts being exchanged in Ethereum futures. With the quotation of futures on the regulated Chicago Mercantile Exchange, we have more tangible inside information on how or where investors are positioned regarding Ethereum price action. In the chart below, the green line represents the number of long contracts, aka the buyers; the red line represents the total number of short contracts, the sellers; and the panel below shows who had the upper hand at any given moment, with either the overall position between buyers and sellers to be net short or long.
An interesting element already to pencil in is that volume has never been as high as in November and has been waning a little in December. That last one does not come as a surprise, as the delay and doubt over the Christmas rally made traders sell off a portion of their interest. At the time of writing, traders are roughly net short -48 contracts, while a total of 7,234 contracts are outstanding. Speaking in soccer terms, that would count as a ‘draw’, meaning that positioning will be rebuilt, with volume likely surpassing that elevated level of November, printing a new record in traded volume in terms of the number of contracts.
ETH CME Futures Net Long / Short
Ethereum price to look to the upside in 2023
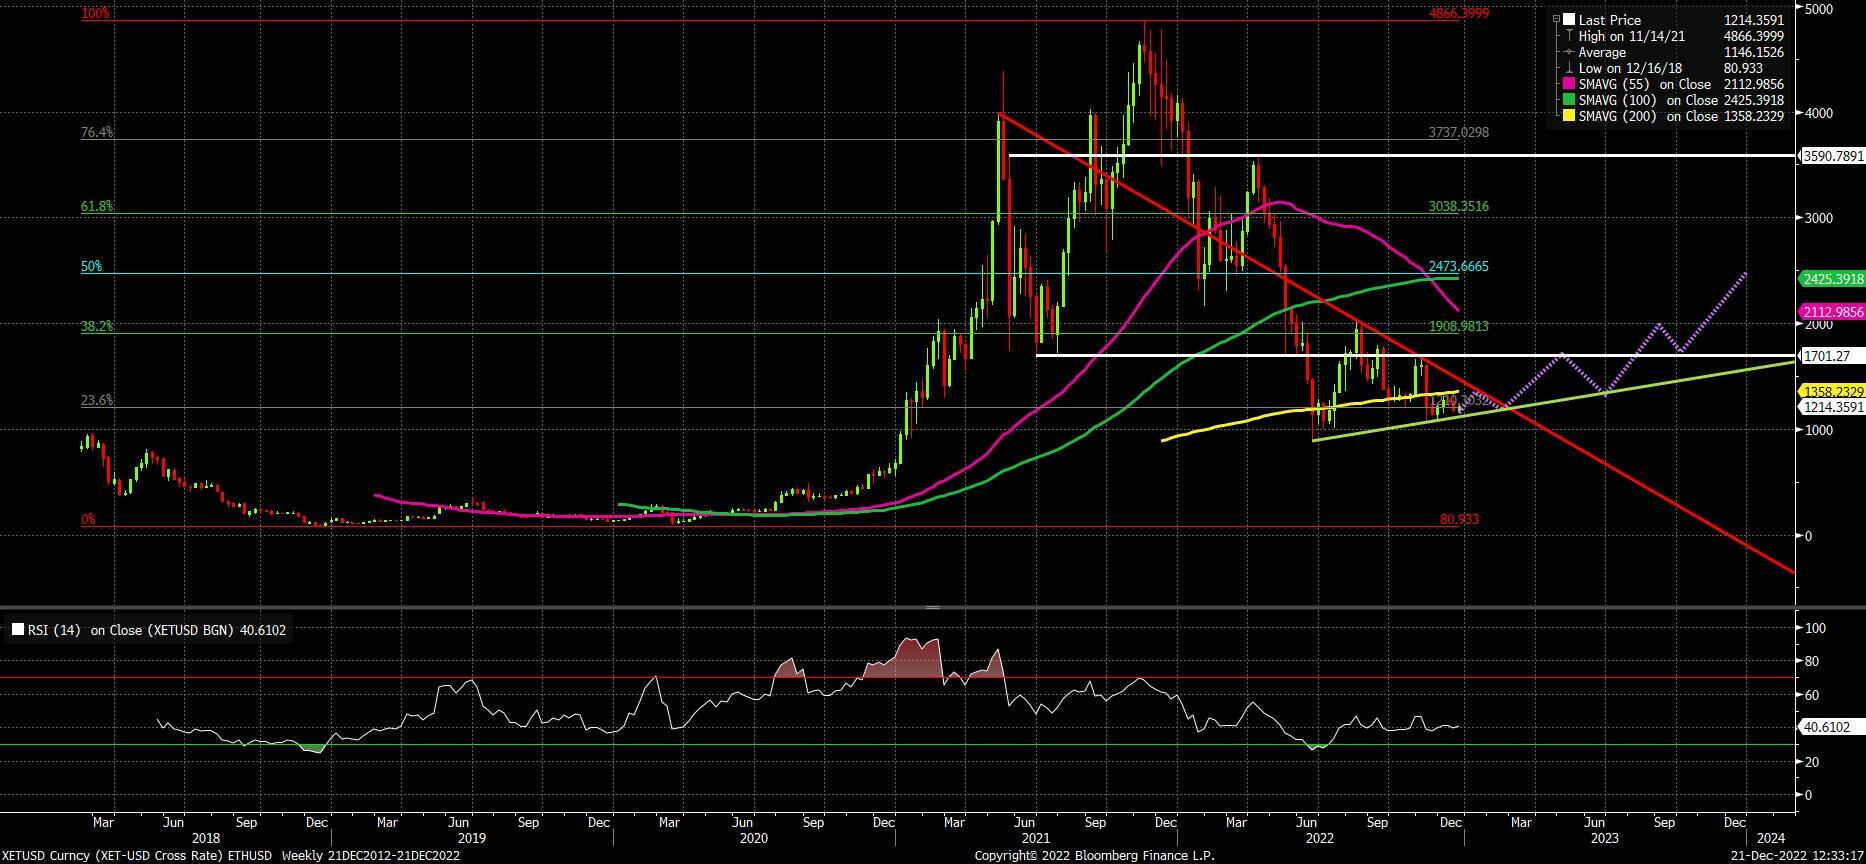
To sum up, all the above elements should be able to plot a roadmap from now on how Ethereum price will behave. As mentioned, that breakout is due to bullish motivation towards $1,700. Expect that level to be reached by April or May, followed by the seasonal sell-off that can be perceived from the seasonality chart.
For the second half of the year, Ethereum price should bounce yet again from that ascending trend line and, this time, pierce through $1,700 to test $2,000. There, Ethereum price could find a rejection to fit the timing of the seasonal September dip, finding support at $1,700. Expect bulls to load up and see a huge bull run towards roughly $2,400 by then, as the US Federal Reserve might have reached its pivotal level and could even start cutting rates, triggering a goldilocks scenario.
ETH/USD Weekly Chart forecast plotted
Information on these pages contains forward-looking statements that involve risks and uncertainties. Markets and instruments profiled on this page are for informational purposes only and should not in any way come across as a recommendation to buy or sell in these assets. You should do your own thorough research before making any investment decisions. FXStreet does not in any way guarantee that this information is free from mistakes, errors, or material misstatements. It also does not guarantee that this information is of a timely nature. Investing in Open Markets involves a great deal of risk, including the loss of all or a portion of your investment, as well as emotional distress. All risks, losses and costs associated with investing, including total loss of principal, are your responsibility. The views and opinions expressed in this article are those of the authors and do not necessarily reflect the official policy or position of FXStreet nor its advertisers. The author will not be held responsible for information that is found at the end of links posted on this page.
If not otherwise explicitly mentioned in the body of the article, at the time of writing, the author has no position in any stock mentioned in this article and no business relationship with any company mentioned. The author has not received compensation for writing this article, other than from FXStreet.
FXStreet and the author do not provide personalized recommendations. The author makes no representations as to the accuracy, completeness, or suitability of this information. FXStreet and the author will not be liable for any errors, omissions or any losses, injuries or damages arising from this information and its display or use. Errors and omissions excepted.
The author and FXStreet are not registered investment advisors and nothing in this article is intended to be investment advice.
Recommended Content
Editors’ Picks

Cardano stabilizes near $0.62 after Trump’s 90-day tariff pause-led surge
Cardano stabilizes around $0.62 on Thursday after a sharp recovery the previous day, triggered by US Donald Trump’s decision to pause tariffs for 90 days except for China and other countries that had retaliated against the reciprocal tariffs announced on April 2.

Solana signals bullish breakout as Huma Finance 2.0 launches on the network
Solana retests falling wedge pattern resistance as a 30% breakout looms. Huma Finance 2.0 joins the Solana DeFi ecosystem, allowing access to stable, real yield. A neutral RSI and macroeconomic uncertainty due to US President Donald Trump’s tariff policy could limit SOL’s rebound.

Bitcoin stabilizes around $82,000, Dead-Cat bounce or trendline breakout
Bitcoin (BTC) price stabilizes at around $82,000 on Thursday after recovering 8.25% the previous day. US President Donald Trump's announcement of a 90-day tariff pause on Wednesday triggered a sharp recovery in the crypto market.

Top 3 gainers Flare, Ondo and Bittensor: Will altcoins outperform Bitcoin after Trump's tariff pause?
Altcoins led by Flare, Ondo and Bittensor surge on Thursday as markets welcome President Trump's tariff pause. Bitcoin rally falters as traders quickly book profits amid Trump's constantly changing tariff policy.

Bitcoin Weekly Forecast: Tariff ‘Liberation Day’ sparks liquidation in crypto market
Bitcoin (BTC) price remains under selling pressure and trades near $84,000 when writing on Friday after a rejection from a key resistance level earlier this week.

The Best brokers to trade EUR/USD
SPONSORED Discover the top brokers for trading EUR/USD in 2025. Our list features brokers with competitive spreads, fast execution, and powerful platforms. Whether you're a beginner or an expert, find the right partner to navigate the dynamic Forex market.


%202022-12-21%2012-39-24-638072200099275702.jpg)
