Ethereum Price Forecast 2022: ETH to continue surging despite heightened volatility
- Ethereum price action is likely to remain bullish for the first six months of 2022.
- Upside potential could more than double Ethereum’s current valuation.
- Downside risks remain but are likely to not occur until Q3 2022.

The following article contains price and date projection analysis for Ethereum price utilizing the methods of W.D. Gann and other traditional forecasting methods. The purpose is not to target a specific date or a specific price.
Instead, the goal is to identify a range of time in the future, which is highly likely to be a turning point for any trend or corrective move. Additionally, the purpose is to identify a price range and value area in that same time period.
Fundamental Considerations
Ethereum generated substantial momentum throughout 2021, none more important than the continued updates to Ethereum 2.0. The most important of 2021 was the recent release on December 1, 2021 in the form of the Beacon Chain. The Beacon Chain is one of the final steps to convert Ethereum from Proof-of-Work to Proof-of-Stake.
Major Ethereum Update for 2022: The Merge
The Merge is the next step in the entire Ethereum 2.0 roadmap and the final step that will actually convert Ethereum into a Proof-of-Stake network. Essentially, The Merge will combine the current Ethereum Mainnet with the Beacon Chain. Simply put, the old-school method of mining Ethereum will end (Proof-of-Work like Bitcoin). Instead, staking Ethereum is how consensus will be achieved.
While The Merge will convert Ethereum from Proof-of-Work to Proof-of-Stake, there is one major feature that will not be available post-Merge: the ability to withdraw staked ETH. While not a major issue for long-term hodlers and former Proof-of-Work entities that converted from mining to staking, the small investor will have a hard time stomaching the lock-up of ETH for an undetermined amount of time without the ability to withdraw when needed.
The anticipated release of The Merge is in the first half of 2022.
Scalability and Sharding
Shards are the next step in the Ethereum 2.0 process. Consisting of multiple upgrades, in a nut-shell the purpose of Shard chains is to make it easier to run a node by reducing major hardware requirements. How this affects scalability and improves accessibility really cannot be underestimated.
Consider the scaling difficulties of a Proof-of-Work system: massive ‘farms’ of mining hardware in warehouses that utilize significant energy inputs and resource management. Sharding will allow individuals to become validators with the use of only a laptop or a smartphone.
The upgrades to the Ethereum network regarding Shards will be over several major upgrades, some which have yet to be defined and are still being discussed.
The anticipated release of the first Shard update is in late Q4 2022 but is more likely in 2023.
Price Confluence zones
How are future price levels determined if they have never traded at those price levels before? A series of different types of analysis should be completed to speculate and project a future price range.
For this analysis, I will be utilizing Elliot Wave Theory, natural harmonic values found in the light and sound spectrum – specifically the methods by the great Gann analyst, Tony Plummer (The Law of Vibration, and The Life Cycle Hypothesis), Gann's Square of 9, Gann's Wheel of 24, Gann's Hexagon Chart, and Fibonacci Expansion zones.
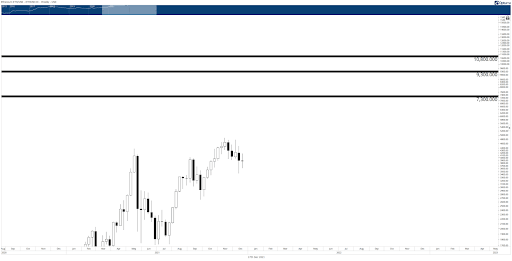
The results of this analysis identified three primary ranges above Ethereum's current value area to watch in 2022 for Ethereum price:
$7,300 - $7,450 Price Zone
This range contains the 50% Fibonacci confluence level, 180-degree dynamic Square of 9 angle, 120-degree dynamic hex angle, and the 360-degree static Square of 9 angle.
$9,200 - $9,400
This range contains the 270-degree static Wheel of 24 angle, Inner Octave note of Mi, 240-degree dynamic hex angle, and the 360-degree static Square of 9 angle.
$10,700 - $10,900
This range contains the 161.8% Fibonacci expansion, 360-degree dynamic hexagon angle, Inner Octave note of So, 90-degree dynamic Square of 9 angle, and the 90-degree Wheel of 24 angle.
ETH/USD Future Price Confluence Zones
Time Cycle Analysis
In addition to projecting price levels in the future, the same approach can be taken with time. For time cycle analysis, most of the analysis comes from Gann's work in major and minor time cycles and his use of astronomical cycles. The time studies are further supplemented with the Ichimoku Kinko Hyo system's Time Principle and Hurst Cycle Analysis.
After completing this analysis, a massive cluster of cycles complete and coalesce in mid-June 2022 to July 2022. Specifically, Ethereum price is projected to be at or near a new all-time high within the June and July 2022 date range. The time clusters include the following time cycle analysis methods:
Gann's Square of 9 dates.
Gann's Cycle of the Inner year day counts.
Gann's Master Square of 12 weekly counts.
Gann's Master Square of 12 monthly counts.
Ichimoku Monthly Kumo Twist
Lunar Phase (New and Full Moons)
Lunar Apogee and Perigee
Hurst Cycles
Mid-Point of Gann's Square of a Range
Planetary Aspects
Anniversary Dates
Declination Cycle
The 850-day Ethereum bull cycle
While all cryptocurrencies, including Bitcoin, still have minimal data to complete a sufficient cycle analysis, some of those cycles are repeated. Both Bitcoin and Ethereum show that their major bull runs last roughly 850 days (sometimes less, sometimes more).
However, the Cycle was interrupted and likely terminated during the Covid-19 crash in 2020. That crash initiated a sort of reset button. The projected date range of the current bull market high is likely to terminate around the 854th day.
Ceres Declination Cycle
Perhaps the most critical component of this analysis is the major asteroid Ceres' Declination Cycle. Ethereum price tends to closely follow the Ceres Declination swing cycle – almost too exact at times.
Bitcoin is also very sensitive to this Cycle and has been for almost twelve years. Consequently, a significant number of the time clusters fall on the extreme highs and lows of the Ceres Declination cycle.
BTC/USD Declination Cycle
The current Ceres Declination Cycle peaks in mid-June 2022 and begins to slope south in early July 2022
June 4 – Geocentric Mars Conjunct Jupiter exits
June 14 – 90-degree Square of 9 Date (from the 2020 Covid crash low)
June 30 – New Moon, Moon Apogee
July 14 – Full Moon, Moon Perigee
July 15 – New Square of a Range Time Cycle
July 27 – Earth Conjunct Pallas begins
Dates of importance beyond 2022, even 2023, can be forecasted. In 2024, a significant swing low of importance is likely to occur during the low of the Ceres Declination cycle.
Ceres Declination Cycle bottoms around September 23, 2024, and begins to turn higher around October 4, 2024
August 19 – Geocentric Mars Conjunct Jupiter exits
August 20 – Full Moon, Moon Perigee
September 14 – 90-degree Square of 9 date (from the 2020 Covid crash low)
October 11 – New Square of a Range Time Cycle
ETH/USD Gann Square of a Range and Ceres Declination Cycle
Putting it all together
January 2022 – July 2022
Relatively muted price action should be expected for Ethereum price. A slow but steady trudge higher to hit one of the three price confluences around the $7,400, $9,400, or $10,900 value areas around mid-June to July 2022 is expected.
July 15 is most likely when the genuine conviction of selling pressure begins.
July 2022 – January 2023
Weakness and selling pressure are likely to generate a 30% to 40% drop from the all-time highs, followed by a relief rally in January 2023.
January 2023 - April 2023
The relief rally is likely to terminate between the end of April 2023 to beginning of May 2023.
May 2023 – October 2024
The relief rally for Ethereum price will generate some false hope, with selling pressure resuming in May 2023 and extending into the Fall of 2024. The lows of 2024 are likely to match the current median retracement percentages of 75% (often more).
If Ethereum's new all-time high were near the $7,400 value area, then the low in October 2024 would likely be near the $3,700 value area.
If the all-time high was in the $9,400 range, the lows in October 2024 would be around $4,700.
Finally, if Ethereum hits a new all-time high near the $10,900 zone, the lows in October 2024 would be near the $5,400 price range.
Gregor Horvat projects a bearish correction for the ETH/USD pair on his Elliott Wave analysis:
ETH/USD Elliott Wave Analysis

Ethereum is in uptrend, an impulsive one, so be aware of more upside, but possibly after a retracement back into a fourth wave. Ideally there will be limited upside near 5k for wave (III), so perfect supports for a next bounce is around 3000 level followed by 1500USD.
Forecast Poll 2022
| Forecast | Q1 - Mar 31st | Q2 - Jun 30th | Q4 - Dec 31st |
|---|---|---|---|
| Bullish | 37.5% | 50% | 50% |
| Bearish | 25% | 0% | 0% |
| Sideways | 37.5% | 50% | 50% |
| Average Forecast Price | 4321.1250 | 4688.1250 | 5522.5000 |
| EXPERTS | Q1 - Mar 31st | Q2 - Jun 30th | Q4 - Dec 31st |
|---|---|---|---|
| Alberto Muñoz | 3375.0000 Bearish | 4000.0000 Sideways | 4500.0000 Sideways |
| Andrew Lockwood | 4800.0000 Bullish | 5760.0000 Bullish | 6720.0000 Bullish |
| Brad Alexander | 4800.0000 Bullish | 3500.0000 Sideways | 5000.0000 Sideways |
| Brian Wang | 5130.0000 Bullish | 6955.0000 Bullish | 7310.0000 Bullish |
| Navin Prithyani | 4500.0000 |


