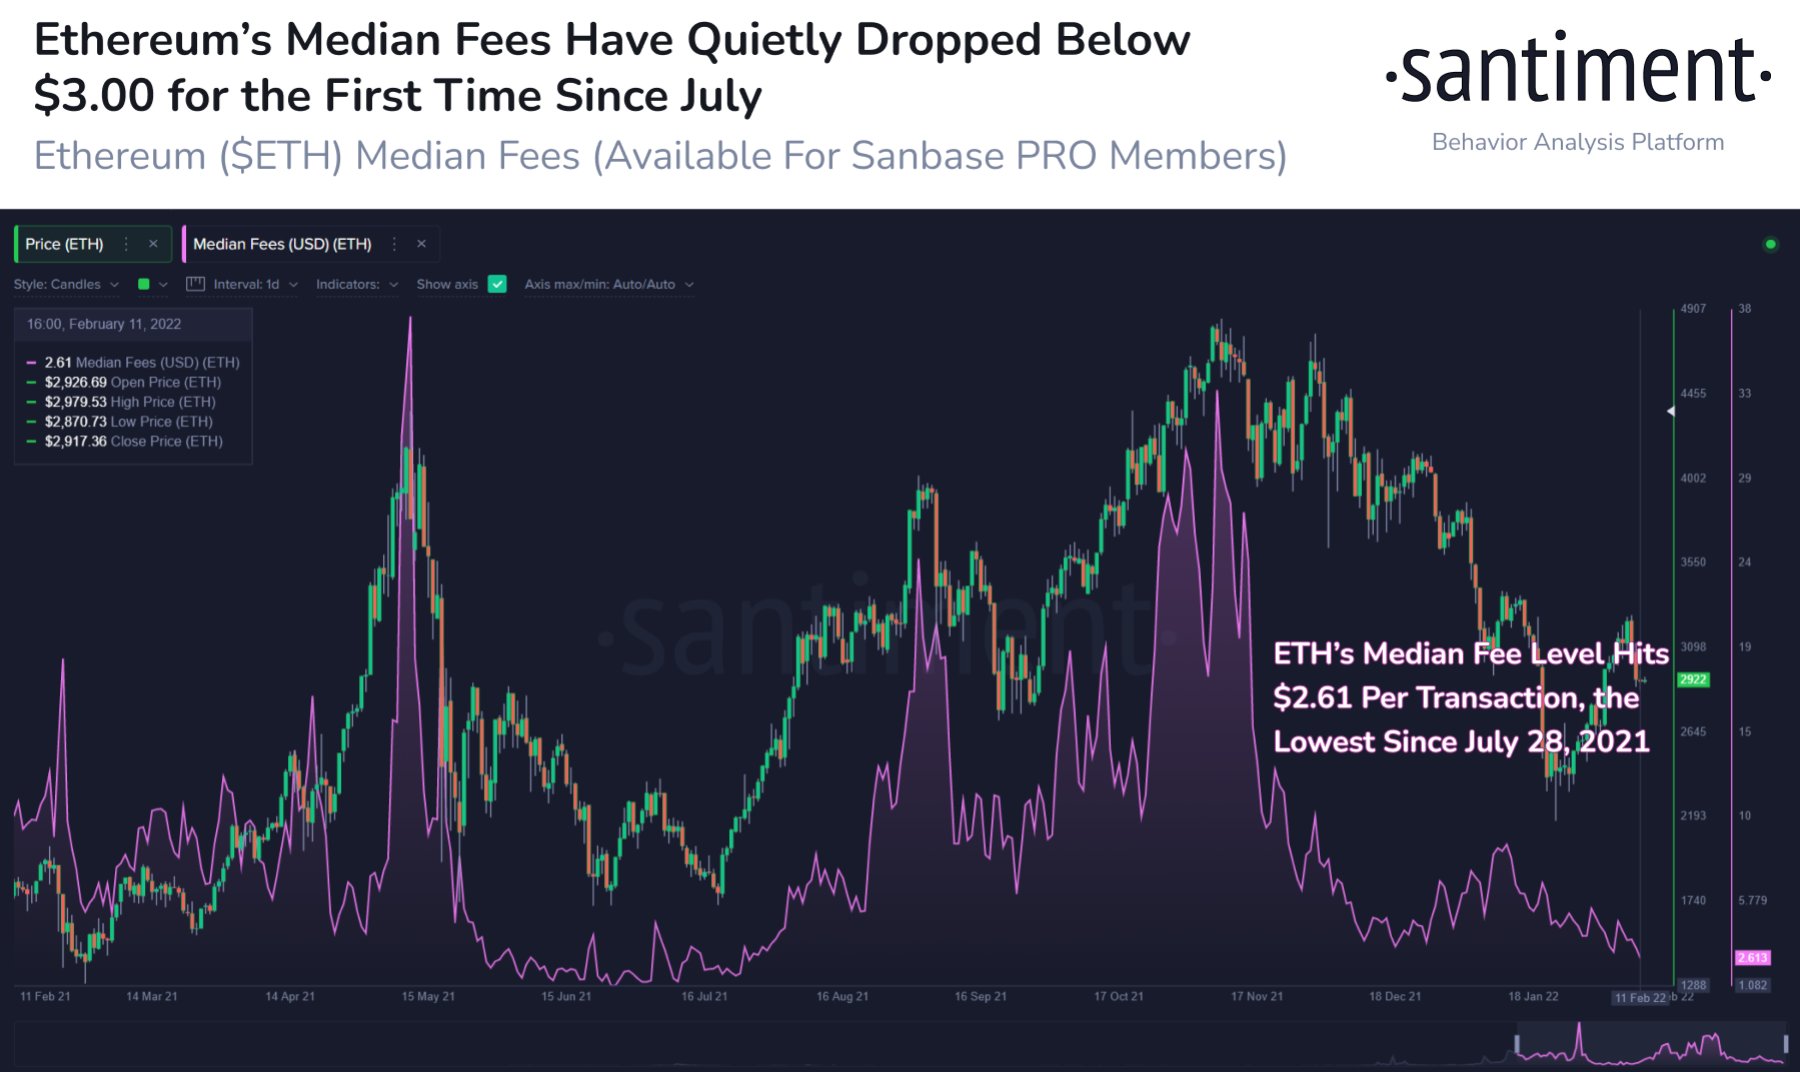
• Ethereum transaction fees have dropped to multi-month lows, indicating that the token could see a reversal in its price.
  • The figure represents a decline of over 75% of the average fee price since November 2021.
  • Ethereum could be preparing for a 25% climb if a key support level holds. 

While Ethereum price slid lower below $3,000, the network’s median fees have dropped below $3, suggesting that demand for ETH transactions have been low. Increased scalability and lower transaction costs could improve investors’ outlook on the asset, boosting the token’s price.

Ethereum fees drop to July 2021 lows 

Ethereum transaction fees have reached its lowest level since July 28, 2021, as ETH price dropped below $3,000. According to on-chain analytics platform Santiment, low fees usually correlate with a bounce in the asset’s price. 

The figure represents a decrease of over 75% of the average fee price since November 2021, when fees reached over $60 on average.

ETH fees

Ethereum median fees

Ethereum fees have been critical to the sustainability of the blockchain network, as users who create transactions must be involved in a bidding process to have their operations processed more quickly. The higher fees paid to miners, the faster the confirmation process is for the transaction.

To ease the burden of paying high transaction fees is the Ethereum Consensus Layer, formerly known as ETH 2.0, which aims to introduce proof-of-stake and scalability solutions such as sharding which could increase the transaction processing capacity to nearly 100,000 transactions per second.

Vitalik Buterin, co-founder of Ethereum recently introduced the concept of a “near-future hard fork” that would include “blob-carrying transactions” which could temporarily relieve scalability concerns before sharding begins. The proposed solution is expected to be adopted in the Shanghai hard fork.

Ethereum price gears up for 25% ascent

Ethereum price could be headed for a 25% rise to tag the upper boundary of the ascending parallel channel at $3,584 on the 12-hour chart

The first line of resistance will emerge at the 21 twelve-hour Simple Moving Average (SMA) at $3,039, coinciding with the 78.6% Fibonacci retracement level. ETH may also encounter a hurdle at the 100 twelve-hour SMA at $3,131, intersecting with the middle boundary of the governing technical pattern.

ETH

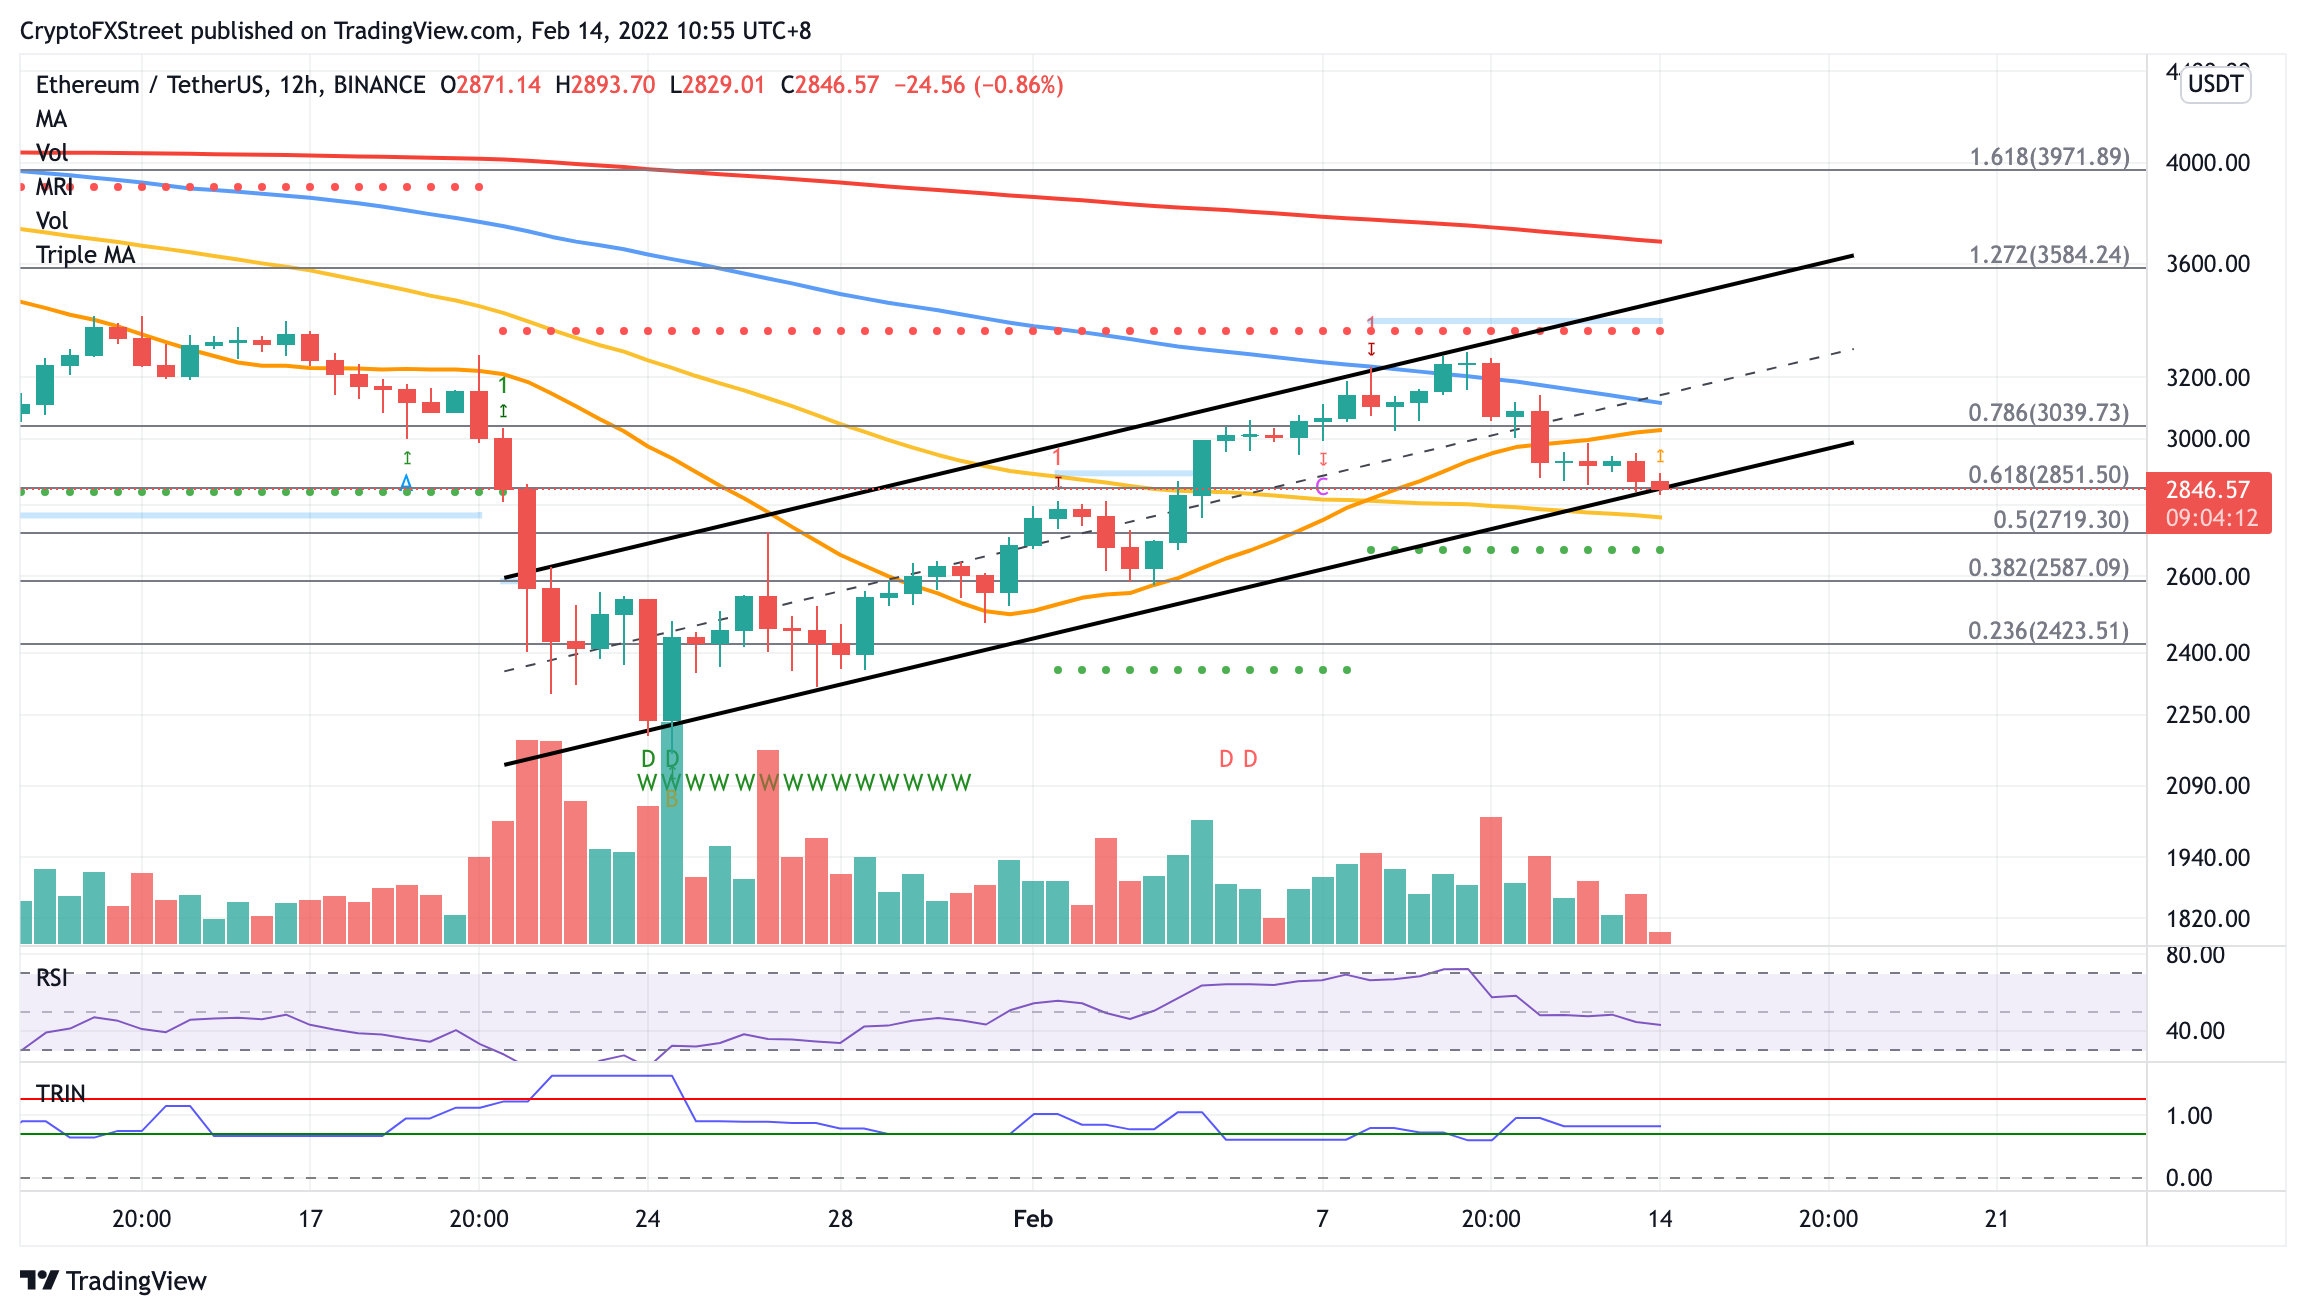
ETH/USDT 12-hour chart

In order for the bullish outlook to be validated, Ethereum price must sustain above the lower boundary of the prevailing chart pattern at $2,851 which acts as a reliable support. An increase in selling pressure may push ETH lower toward the 50 twelve-hour SMA at $2,761.


Note: All information on this page is subject to change. The use of this website constitutes acceptance of our user agreement. Please read our privacy policy and legal disclaimer. Opinions expressed at FXstreet.com are those of the individual authors and do not necessarily represent the opinion of FXstreet.com or its management. Risk Disclosure: Trading foreign exchange on margin carries a high level of risk, and may not be suitable for all investors. The high degree of leverage can work against you as well as for you. Before deciding to invest in foreign exchange you should carefully consider your investment objectives, level of experience, and risk appetite. The possibility exists that you could sustain a loss of some or all of your initial investment and therefore you should not invest money that you cannot afford to lose. You should be aware of all the risks associated with foreign exchange trading, and seek advice from an independent financial advisor if you have any doubts.

Join Telegram

Recommended content


Recommended Content

Editors’ Picks

Ripple on-chain metrics show bullish signs amidst legal struggle with SEC, XRP eyes recovery

Ripple on-chain metrics show bullish signs amidst legal struggle with SEC, XRP eyes recovery

Ripple made a comeback above $0.48 on Tuesday and hovers above that level in Wednesday’s European session. Ripple on-chain metrics such as transaction volume and Network Realized Profit/Loss have turned bullish, supporting a recovery in the altcoin. 

More Ripple News

Bitcoin price falls amidst German government transfers, miners activity

Bitcoin price falls amidst German government transfers, miners activity

Bitcoin (BTC) extends correction on Wednesday and hovers around $61,000 after finding resistance near the $64,000 level on Monday. Recent on-chain data indicates heightened selling activity from Bitcoin miners early in the week. 

More Bitcoin News

Crypto Today: Bitcoin erases gains from end of June, Ethereum declines while Ripple holds

Crypto Today: Bitcoin erases gains from end of June, Ethereum declines while Ripple holds

Bitcoin wipes out gains from the last week of June and falls below $60,000 on Wednesday. Ethereum and top altcoins ranked by market capitalization erased gains as the inflation outlook worsened. Ripple holds on to recent gains and hovers above $0.48 on Wednesday. 

More Cryptocurrencies News

Three reasons why altcoins could shake off losses this week

Three reasons why altcoins could shake off losses this week

On-chain data from Santiment shows that altcoins are currently in the opportunity zone, or generating buy signals. The top three altcoins in the buy zone are Basic Attention Token (BAT), Chromia (CHR), and Highstreet (HIGH), per Santiment. 

More Altcoins News

Bitcoin: BTC price correction could end in July, according to seasonal data

Bitcoin: BTC price correction could end in July, according to seasonal data

Bitcoin (BTC) price appears poised for a decline this week, influenced by slight outflows in US spot ETFs, selling activity among BTC miners, and a combined transfer of 4,690.28 BTC to centralized exchanges by the US and German governments.

Read full analysis

BTC

ETH

XRP