|

Ethereum price analysis: ETH/USD extends slide below $400 following Friday's sharp drop

  • Ethereum pushed lower after breaking below $400 on Friday.
  • A weekly close below $400 could open the door for further losses. 
  • Critical support seems to have formed near $365.

Ethereum (ETH/USD) closed the first three days of the week in the negative territory and staged a rebound on Thursday. However, the technical correction came to an end on Friday and ETH/USD broke below critical $400 and lost 6.7%. During the first half of the day on Saturday, Ethereum extended its slide to a fresh nine-day low of $379.50 but recovered its losses to turn flat near $389.

Ethereum technical outlook

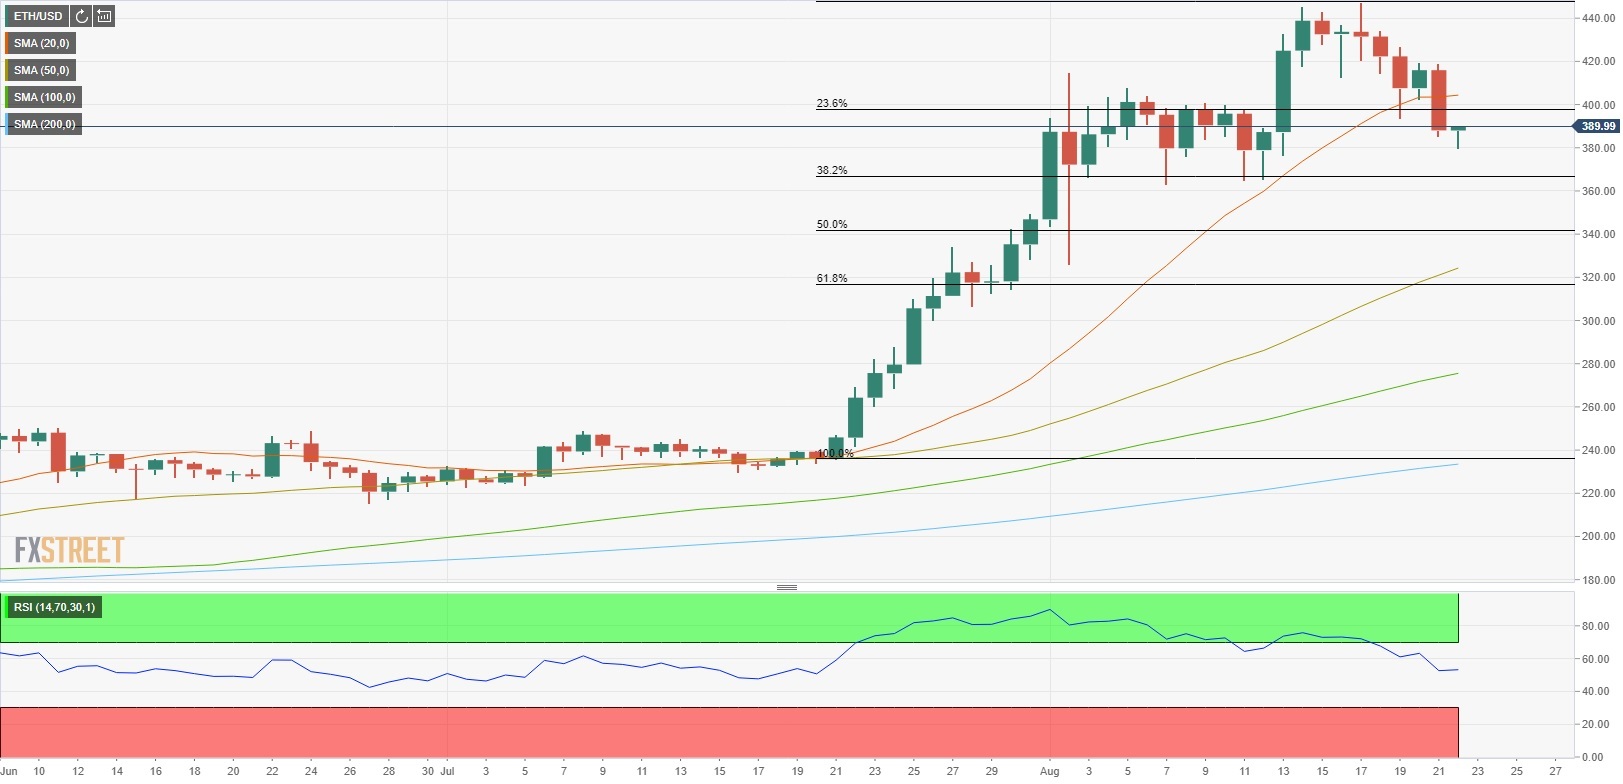
Ethereum closed the day below the 20-day SMA for the first time in more than a month, suggesting that the near-term outlook is turning bearish. Moreover, ETH/USD broke below $400 (psychological level/Fibonacci 23.6% retracement of later-July to mid-August uptrend). Meanwhile, the RSI indicator on the daily chart continued to push lower and is now testing 50.

On the downside, $365 (Fibonacci 38.2% retracement) aligns as the next support ahead of $340 ((Fibonacci 50% retracement) and $325 (100-day SMA). On the other hand, a decisive move above $400 could cause the near-term outlook to turn bullish. The 20-day SMA at $405 could be seen as the next technical resistance.

ETH/USD chart (daily)

Author

Eren Sengezer

As an economist at heart, Eren Sengezer specializes in the assessment of the short-term and long-term impacts of macroeconomic data, central bank policies and political developments on financial assets.

More from Eren Sengezer
Share:

Editor's Picks

Ripple bulls defend key support amid waning retail demand and ETF inflows

XRP ticks up above $1.40 support, but waning retail demand suggests caution. XRP attracts $4 million in spot ETF inflows on Thursday, signaling renewed institutional investor interest.

Crypto Today: Bitcoin, Ethereum, XRP rebound as risk appetite improves

Bitcoin rises marginally, nearing the immediate resistance of $68,000 at the time of writing on Friday. Major altcoins, including Ethereum and Ripple, hold key support levels as bulls aim to maintain marginal intraday gains.

Bitcoin Weekly Forecast: No recovery in sight 

Bitcoin price continues to trade sideways between $65,729 and $71,746, extending its consolidation since February 7. US-spot ETFs record an outflow of $403.90 million through Thursday, pointing to the fifth consecutive week of withdrawals.

Pi Network Price Forecast: PI recovery stalls amid profit-taking

Pi Network tests 50-day EMA support on Friday, after a 5% decline the previous day. PiScan data shows large deposits on CEXs totaling over 4 million PI tokens in the last 24 hours, reflecting an exodus of investors taking profits.

Bitcoin Price Annual Forecast: BTC holds long-term bullish structure heading into 2026

Bitcoin (BTC) is wrapping up 2025 as one of its most eventful years, defined by unprecedented institutional participation, major regulatory developments, and extreme price volatility.

Bitcoin: No recovery in sight

Bitcoin (BTC) price continues to trade within a range-bound zone, hovering around $67,000 at the time of writing on Friday, and falling slightly so far this week, with no signs of recovery.