Ethereum Price Analysis: ETH/USD descending channel resistance breakout loses steam short of $220


  • Ethereum bears are threatening reversal to $200 after bulls failed to clear the resistance at $220.
  • ETH/USD is still in the hand of the buyers in spite of the retreat from Monday highs to the short term support at $210.

Ethereum price recently broke out of a descending channel resistance in a bid to push further the recovery started after the nosedive to $175 support in May. The bullish momentum was particularly forceful especially when it came to penetrating the seller congestion at the 50 SMA and the 100 SMA in the 4-hour range. The price action extended above the critical $200 level but fizzled out short of $220.

An intraday high has been reached at $214.86 on Tuesday (lower than Monday’s high above $216). This shows that sellers are getting more confident and could continue to gain more traction against the bulls in the short term.

Meanwhile, the price is teetering 1.86% lower on the day. It has a market value of $210.24 amid a bullish biased trend and high volatility. Looking at the MACD, Ether is still primed for more gains towards $220 as long as the short term support at $210 holds. The indicator is settling into a sideways trend in the positive region. Besides, a minor bullish divergence suggests that buyers have the upper hand.  However, the RSI is pointing south as a warning to the bulls to up their game or else risk testing the crucial $200 level.

ETH/USD 4-hour chart

ETH/USD price chart

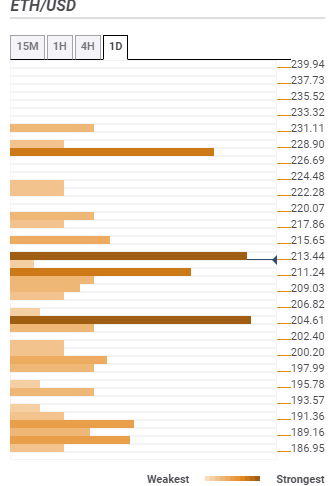
Ethereum confluence resistance and support

Resistance one: $213.44 – Is home to the previous low 4-hour, the Bollinger Band 1-hour middle curve, the Fibonacci 38.2% one-day and the SMA 100 15-minutes.

Resistance two: $228.90 – Highlighted by the previous month high, the pivot point one-week resistance two and pivot point one-day resistance one.

Support one: $211.24 – This zone converges the Bollinger Band one-hour lower, the Fibonacci 61.8% one-day and the SMA ten 4-hour.

Support two: $204.61 – Is the zone where the SMA five one-day, the Fibo 23.6% one-month and the BB one-day middle curve meet.

fxsoriginal


Information on these pages contains forward-looking statements that involve risks and uncertainties. Markets and instruments profiled on this page are for informational purposes only and should not in any way come across as a recommendation to buy or sell in these assets. You should do your own thorough research before making any investment decisions. FXStreet does not in any way guarantee that this information is free from mistakes, errors, or material misstatements. It also does not guarantee that this information is of a timely nature. Investing in Open Markets involves a great deal of risk, including the loss of all or a portion of your investment, as well as emotional distress. All risks, losses and costs associated with investing, including total loss of principal, are your responsibility. The views and opinions expressed in this article are those of the authors and do not necessarily reflect the official policy or position of FXStreet nor its advertisers. The author will not be held responsible for information that is found at the end of links posted on this page.

If not otherwise explicitly mentioned in the body of the article, at the time of writing, the author has no position in any stock mentioned in this article and no business relationship with any company mentioned. The author has not received compensation for writing this article, other than from FXStreet.

FXStreet and the author do not provide personalized recommendations. The author makes no representations as to the accuracy, completeness, or suitability of this information. FXStreet and the author will not be liable for any errors, omissions or any losses, injuries or damages arising from this information and its display or use. Errors and omissions excepted.

The author and FXStreet are not registered investment advisors and nothing in this article is intended to be investment advice.

Recommended content


Recommended Content

Editors’ Picks

Bitcoin Weekly Forecast: BTC demand and liquidity conditions remain weak

Bitcoin Weekly Forecast: BTC demand and liquidity conditions remain weak

Bitcoin price has been consolidating between $94,000 and $100,000 since early February. US Bitcoin spot ETF data recorded a total net outflow of $489.60 million until Thursday.

More Bitcoin News
Sonic (prev. FTM) rallies as TVL hits record high and market capitalization surpasses $3.1 billion

Sonic (prev. FTM) rallies as TVL hits record high and market capitalization surpasses $3.1 billion

Sonic (S), previous Fantom (FTM), rallies over 20% in the last 24 hours and trades around $0.90 at the time of writing on Friday after rising almost 64% this week. The migration of FTM to S token at a 1:1 ratio was completed on January 17. 

More Cryptocurrencies News
Top 3 Price Prediction Bitcoin, Ethereum, Ripple: BTC gears up for volatility while ETH and XRP fight to stay afloat

Top 3 Price Prediction Bitcoin, Ethereum, Ripple: BTC gears up for volatility while ETH and XRP fight to stay afloat

Bitcoin price has been consolidating between $94,000 and $100,000 since early February; this consolidation phase could soon end. Ethereum price shows signs of strength while Ripple price fights to stay afloat.

More Cryptocurrencies News
Crypto Today: BTC tops $98K on US-Russia diplomacy, while NEAR and Bittensor lead AI tokens’ $30B rally

Crypto Today: BTC tops $98K on US-Russia diplomacy, while NEAR and Bittensor lead AI tokens’ $30B rally

The global crypto market rose 3% on Thursday, adding $45 billion to reach an aggregate market cap of $3.2 trillion. The crypto AI sector witnessed a 15% rally, with Bittensor (TAO) and NEAR emerging as top performers on the day. 

More Cryptocurrencies News
Bitcoin: BTC demand and liquidity conditions remain weak

Bitcoin: BTC demand and liquidity conditions remain weak

Bitcoin (BTC) price has been consolidating between $94,000 and $100,000 since early February, hovering around $98,000 at the time of writing on Friday.

Read full analysis
The Best brokers to trade EUR/USD

The Best brokers to trade EUR/USD

SPONSORED Discover the top brokers for trading EUR/USD in 2025. Our list features brokers with competitive spreads, fast execution, and powerful platforms. Whether you're a beginner or an expert, find the right partner to navigate the dynamic Forex market.

Read More

BTC

ETH

XRP