|

Ethereum Price Analysis: ETH/USD consolidates weekly gains near $440

  • ETH/USD rose impressively in the second half of the week.
  • Ethereum seems to have gone into a consolidation on Saturday.
  • Daily RSI stays above 70, pointing out to a technical correction in near-term.

Ethereum (ETH/USD) staged an impressive rally from Wednesday and gained nearly 15% in the previous three days to touch its highest level in more than two years at $445 on Friday. With the trading action in the cryptocurrency market turning subdued on Saturday, Ethereum is consolidating its gains and was last seen losing 0.4% on the day at $437.

Ethereum technical outlook

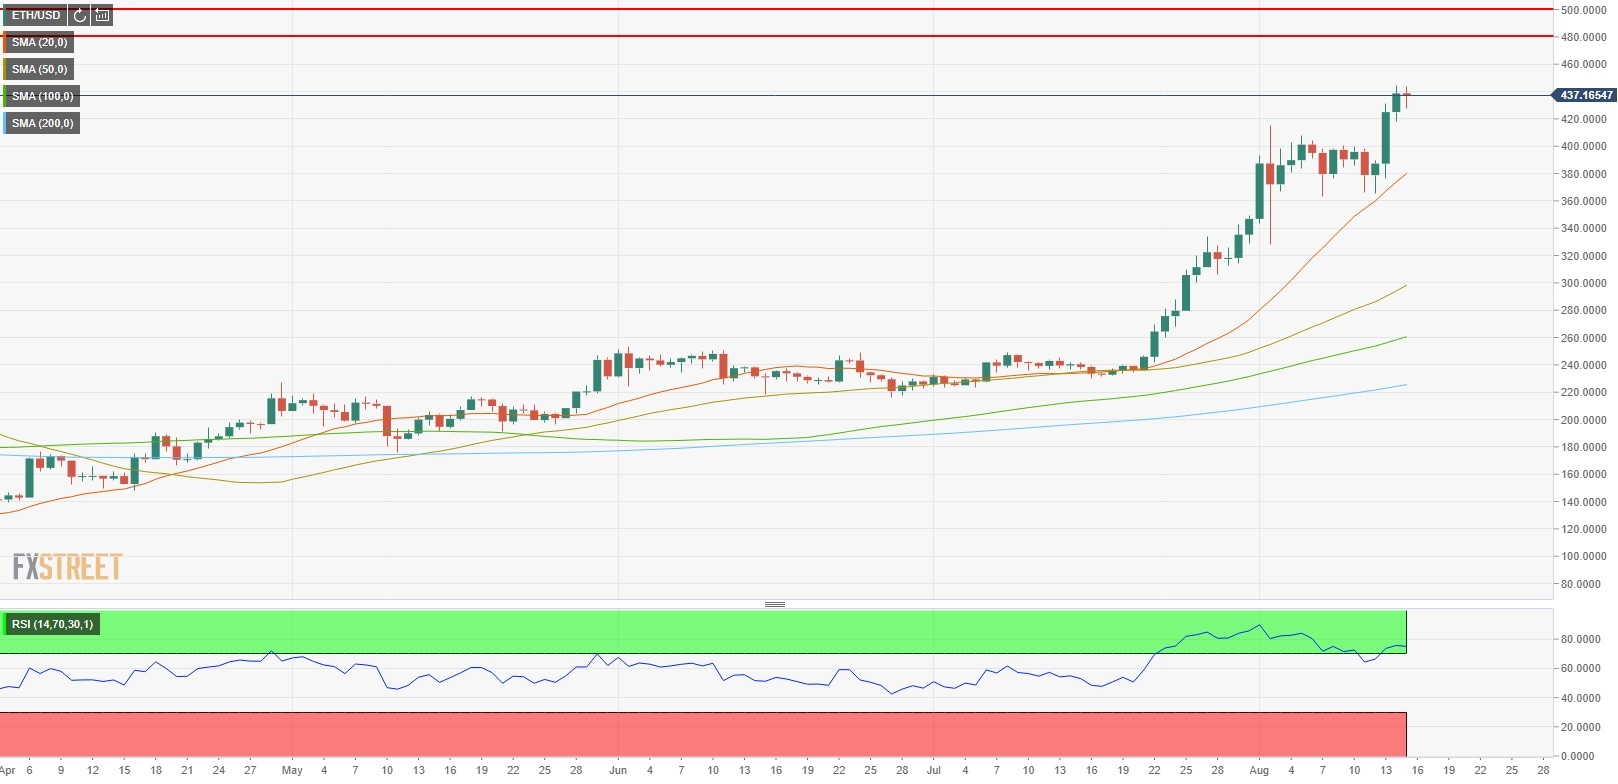
During Thursday's sharp upsurge, the RSI indicator on the daily chart rose above 70 and stayed there as Ethereum continued to add to its gains on Friday. In the near-term, ETH/USD could make a technical correction before trying to renew its two-year highs.

On the downside, $427 (daily low) aligns as the initial support before $400 (psychological level) and $380 (20-day SMA). Resistances are located at $445 (two-year high), $480 (July 2018 static resistance) and $500 (psychological level).

Ethereum daily chart

Additional levels to consider

ETH/USD

Overview
Today last price437.52
Today Daily Change-1.14
Today Daily Change %-0.26
Today daily open438.66
 
Trends
Daily SMA20373.81
Daily SMA50294.12
Daily SMA100258.38
Daily SMA200224.24
 
Levels
Previous Daily High444.78
Previous Daily Low417.91
Previous Weekly High444.78
Previous Weekly Low365.72
Previous Monthly High349.55
Previous Monthly Low223.32
Daily Fibonacci 38.2%434.51
Daily Fibonacci 61.8%428.17
Daily Pivot Point S1422.78
Daily Pivot Point S2406.91
Daily Pivot Point S3395.91
Daily Pivot Point R1449.65
Daily Pivot Point R2460.65
Daily Pivot Point R3476.52

Author

Eren Sengezer

As an economist at heart, Eren Sengezer specializes in the assessment of the short-term and long-term impacts of macroeconomic data, central bank policies and political developments on financial assets.

More from Eren Sengezer
Share:

Editor's Picks

Grass 20% bullish breakout defies broader market weakness

Grass (GRASS) is edging up above $0.30 at the time of writing on Monday. The token’s notable 20% intraday surge stands out amid heightened volatility in the broader crypto market.

XRP slides as US-Iran war weakens sentiment

Ripple remains under pressure, trading around $1.35 at the time of writing on Monday. The remittance token extended its down leg to $1.27 on Saturday after the US, in collaboration with Israel, launched attacks on Iran, killing the nation’s Supreme Leader, Ali Khamenei.

Crypto Today: Bitcoin pares losses, Ethereum and XRP drift lower as Middle East conflict pressures risk assets

Bitcoin, Ethereum and Ripple remain on edge as the Israel-US war on Iran risk-off sentiment. The Crypto King trades above $66,000 at the time of writing on Monday, but is struggling to break through the seller congestion around $67,000.

Bitcoin on brink of breakdown amid US-Iran war

Bitcoin (BTC) remains under pressure near the key support level of $65,700. Trading at $66,400 at the time of writing on Monday, a breakdown below this critical level would suggest a deeper correction ahead.

Bitcoin Price Annual Forecast: BTC holds long-term bullish structure heading into 2026

Bitcoin (BTC) is wrapping up 2025 as one of its most eventful years, defined by unprecedented institutional participation, major regulatory developments, and extreme price volatility.

Bitcoin: Another month of losses, and it’s been five

Bitcoin (BTC) price is stabilizing around $68,000 at the time of writing on Friday, but the Crypto King is poised to close February on a fragile footing, marking its fifth consecutive month of losses since October and a rare start to the year with back-to-back monthly corrections.