Ethereum Price Analysis: ETH pattern envisions a nightmarish 50% decline
- Ethereum price forming a bear pennant on the weekly chart with a jumbo measured move target.
- ETH 61.8% Fibonacci retracement could be instrumental in limiting the downside implications of the pennant.
- A noteworthy decoupling with Bitcoin shows that investors are focused on ETH-specific developments like the London hard fork or technicals.

Ethereum price has been forming a bear pennant on the weekly chart for the last three weeks. Since the smart contracts giant is locked in a technical stranglehold, investors should be patient and constantly mindful of the significant downside implications of the pattern.
Ethereum price action is falling more in line with other altcoins
Ethereum price will undoubtedly see some disruption after London’s hard fork update to address energy usage and high transaction fees. It is one in a series of network upgrades as ETH transitions from Proof-of-Work (PoW) to Proof-of-Stake (PoS) consensus.
The belief is that the hard fork will be successful, making Ethereum more attractive as a store of value, thereby permitting the digital asset to expand its target market.
Based on the governing technical pattern, Ethereum price suggests that the hard fork will not be without problems or setbacks. In fact, the bear pennant is suggesting a measured move target of $1,157 or a decline of 48% based on the preceding flagpole. A drop of that magnitude would easily dismantle support at the May low, the 2018 high and leave ETH positioned near the 50-week simple moving average (SMA).
The first signal that the bear pennant is resolving to the downside is a daily close below $2,200. It would leave Ethereum price below the pennant’s lower trend line and the 50% retracement level at $2,237. Further confirmation will be another daily close below the February high of $2,041, a level that held on a weekly closing basis in May.
If the Ethereum price gets locked into a severe decline, it will discover formidable support at the intersection of the 61.8% retracement at $1,730 with the May low of $1,728 before targeting the May 2018 high of $1,419 and then the 50-week SMA at $1,196.
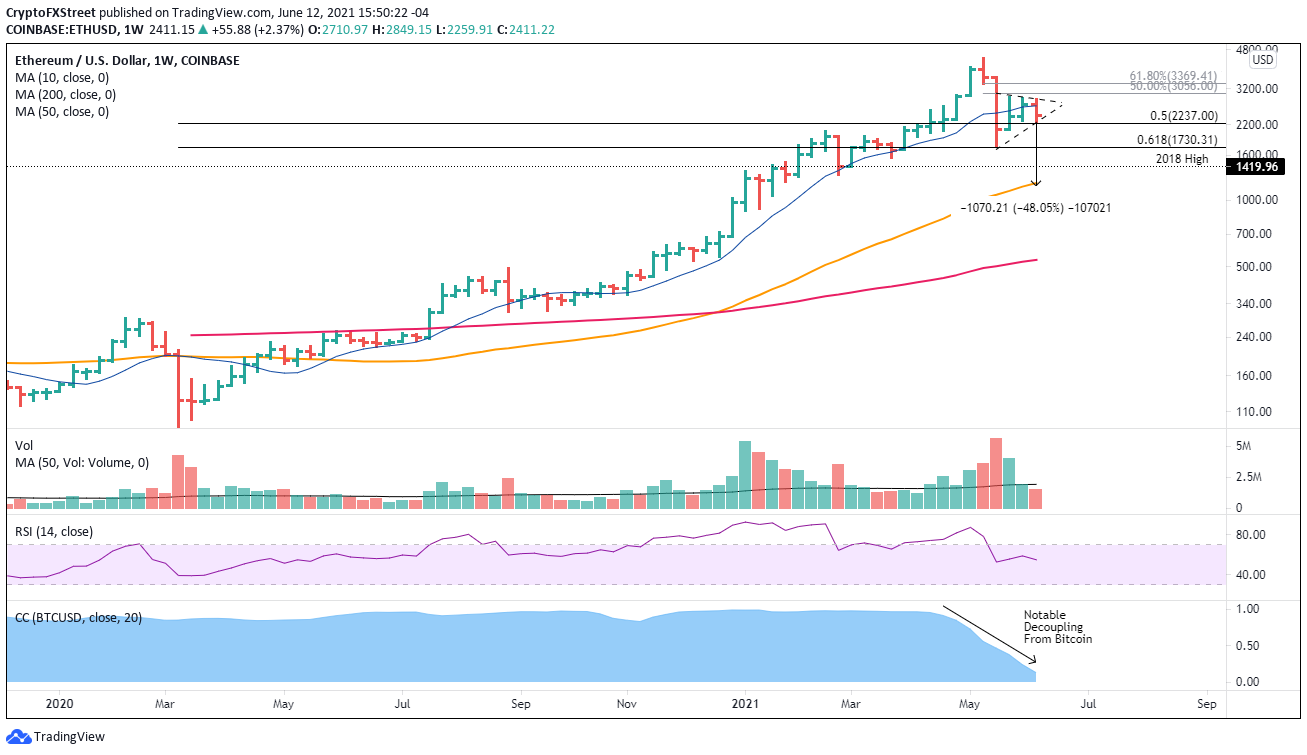
ETH/USD weekly chart
On a weekly chart, Ethereum price would need to close above the 10-week SMA at $2,680 to effect a reversal of fortune for the digital asset, but it would still need a close above the pennant’s upper trend line at $2,860 to confirm.
July is an inflection moment for ETH marked by great anticipation and expectations. At this point, Ethereum price, often a leading indicator, is showing some doubt above the hard fork. Moreover, the continual decline in the correlation coefficient with Bitcoin indicates that Ethereum price moves will be more in line with token-specific events or technicals and will not be notably helped by positive Bitcoin developments, such as the recent El Salvador news.
Author

Sheldon McIntyre, CMT
Independent Analyst
Sheldon has 24 years of investment experience holding various positions in companies based in the United States and Chile. His core competencies include BRIC and G-10 equity markets, swing and position trading and technical analysis.


