- Ethereum is in the initial stages of a colossal inverted H&S pattern breakout.
- The IOMAP reveals the absence of robust resistance, validating the expected upswing.
- Failing to hold above the inverted H&S pattern will pave the way for losses toward $1,600.
Ethereum managed to come out of last week's woods by overcoming the stubborn resistance at $1,600 during the weekend session. The flagship smart contract token extended the action above $1,700, but the uptrend stalled short of $1,800. At the time of writing, Ether is trading around $1,750 following a key technical breakout.
Ethereum upswing eyes $2,000
Ethereum's most recent recovery completed the formation of an inverted head-and-shoulders (H&S). The pattern is usually bullish and results in a price breakout target above the neckline. Ether has already commenced the breakout but faces some resistance toward $1,800. Retesting the neckline support could jumpstart the upswing, paving the way for gains above $1,800.
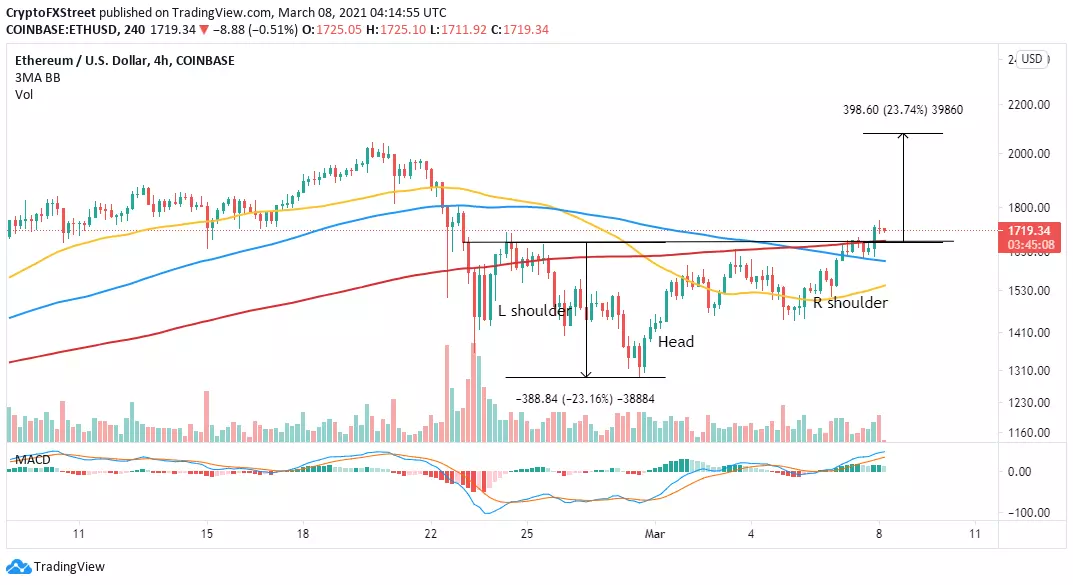
ETH/USD 4-hour chart
The bullish outlook is validated by the Moving Average Convergence Divergence (MACD). A MACD line cross above the signal line added credibility to the upswing. As long as the trend momentum indicator remains stable while moving north, Ethereum would come closer to achieving the target above $2,000.
IntoTheBlock's IOMAP model reveals that Ethereum has been a relatively smooth path toward $2,000. The lack of a formidable resistance could hasten the above-mentioned technical breakout. However, the model directs our attention to a subtle seller congestion zone between $1,890 and $1,932. Here, around 314,400 addresses previously bought roughly 968,000 ETH.
On the downside, Ether is sitting on an area with immense support, confirming that the least resistance path is upwards. The support running from $1,513 and $1,565 has been highlighted by the approximately 329 addresses currently profiting from the 11 million ETH bought within the range.
-637507762971498932.png)
Ethereum IOMAP chart
Looking at the other side of the fence
Ethereum's uptrend has stalled before hitting $1,800 despite the H&S breakout. There's a need to secure high support, preferably at the pattern's neckline. Failing to close the day above this zone may lead to a breakdown toward the 100 Simple Moving Average (SMA) at $1,600 on the 4-hour chart.
Information on these pages contains forward-looking statements that involve risks and uncertainties. Markets and instruments profiled on this page are for informational purposes only and should not in any way come across as a recommendation to buy or sell in these assets. You should do your own thorough research before making any investment decisions. FXStreet does not in any way guarantee that this information is free from mistakes, errors, or material misstatements. It also does not guarantee that this information is of a timely nature. Investing in Open Markets involves a great deal of risk, including the loss of all or a portion of your investment, as well as emotional distress. All risks, losses and costs associated with investing, including total loss of principal, are your responsibility. The views and opinions expressed in this article are those of the authors and do not necessarily reflect the official policy or position of FXStreet nor its advertisers. The author will not be held responsible for information that is found at the end of links posted on this page.
If not otherwise explicitly mentioned in the body of the article, at the time of writing, the author has no position in any stock mentioned in this article and no business relationship with any company mentioned. The author has not received compensation for writing this article, other than from FXStreet.
FXStreet and the author do not provide personalized recommendations. The author makes no representations as to the accuracy, completeness, or suitability of this information. FXStreet and the author will not be liable for any errors, omissions or any losses, injuries or damages arising from this information and its display or use. Errors and omissions excepted.
The author and FXStreet are not registered investment advisors and nothing in this article is intended to be investment advice.
Recommended Content
Editors’ Picks

XRP chart signals 27% jump after SEC-Ripple appeals pause and $50 million settlement
Ripple (XRP) stabilized above $2.00 exemplifying a similar pattern to the largest cryptocurrency by market capitalization, Bitcoin (BTC), which holds firmly above $84,000 at the time of writing on Thursday.

Bitwise lists four crypto ETPs on London Stock Exchange
Bitwise announced on Wednesday that it had listed four of its Germany-issued crypto Exchange-Traded products (ETPs) on the London Stock Exchange. It aims to expand access to its products for Bitcoin (BTC) and Ethereum (ETH) investors and widen its footprint across European markets.

RAY sees double-digit gains as Raydium unveils new Pumpfun competitor
RAY surged 10% on Wednesday as Raydium revealed its new meme coin launchpad, LaunchLab, a potential competitor to Pump.fun — which also recently unveiled its decentralized exchange (DEX) PumpSwap.

Ethereum Price Forecast: ETH face value- accrual risks due to data availability roadmap
Ethereum (ETH) declined 1%, trading just below $1,600 in the early Asian session on Thursday, as Binance Research's latest report suggests that the data availability roadmap has been hampering its value accrual.

Bitcoin Weekly Forecast: Market uncertainty lingers, Trump’s 90-day tariff pause sparks modest recovery
Bitcoin (BTC) price extends recovery to around $82,500 on Friday after dumping to a new year-to-date low of $74,508 to start the week. Market uncertainty remains high, leading to a massive shakeout, with total liquidations hitting $2.18 billion across crypto markets.

The Best brokers to trade EUR/USD
SPONSORED Discover the top brokers for trading EUR/USD in 2025. Our list features brokers with competitive spreads, fast execution, and powerful platforms. Whether you're a beginner or an expert, find the right partner to navigate the dynamic Forex market.