Ethereum Price Analysis: ETH faces short-term bearish correction at $350
- Ethereum network activity and high gas prices have resulted in ETH miners earning more profits.
- Gemini exchange co-founder Cameron Winklevoss believes that the DeFi is different from the ICO trend.

Ethereum miners earn high profits amid the surging network difficulty
Uniswap’s recent launch of the UNI token drove up the gas cost on the Ethereum network. This resulted in miners earning close to $1 million in fees in just one hour. Additionally, Ethereum network activity has resulted in ETH miners making more from transaction fees.
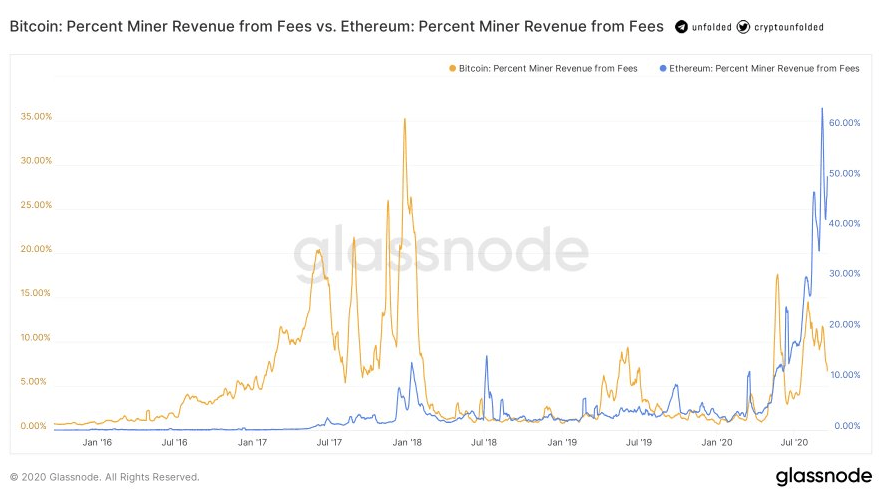
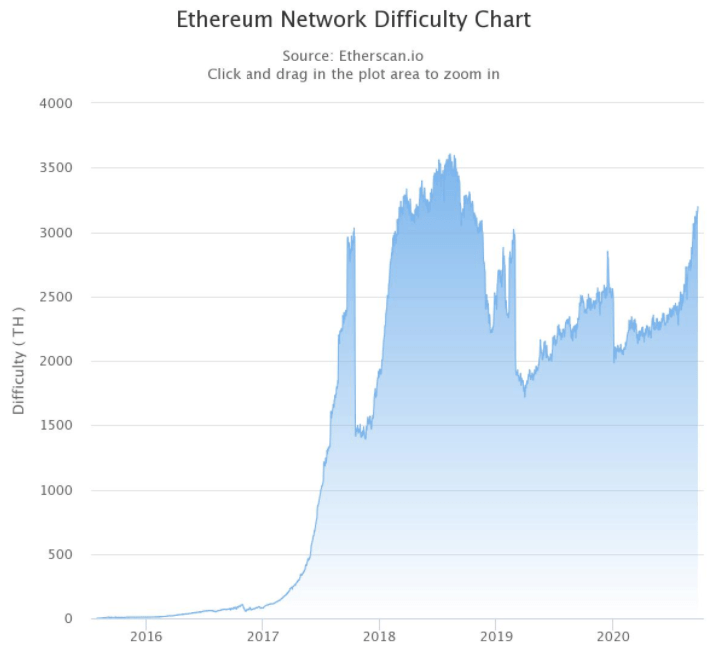
While Ethereum miners are enjoying the current market conditions, the hash rate and the network difficulty is surging. As the ETH’s price started to plummet at the beginning of September, the miners’ revenues were also expected to drop. However, the rising hash rate indicated that the miners were still in profit mining Ether.
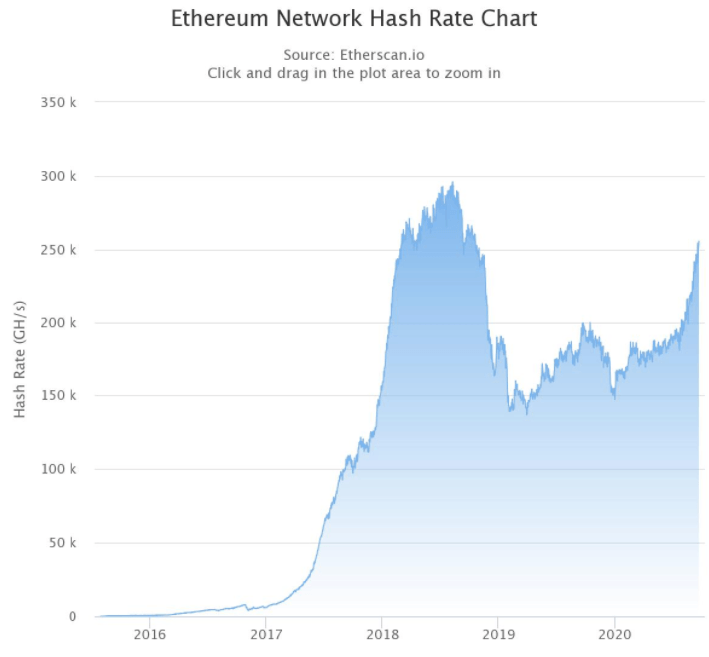
Etherscan data shows that the hash rate has recently reached a two-year high of 255 terahashes per second. This was reportedly due to NVIDIA’s fastest graphic cards, the GeForce RTX 3090. As the mining gets sophisticated, more miners are joining the network. This has contributed to the surging difficulty of the system.
Although the miner revenue from fees was high, the ETH gas cost has seen a notable decrease in the past few days. The average gas price on 17 September was close to 538 Gwen. This value on 21 September fell to 176.
DeFi revolution is not the same as the 2017 ICO craze – Cameron Winklevoss
Cameron Winklevoss, the co-founder of the Gemini exchange, recently said that the DeFi revolution is not the same as the 2017 ICO trend.
DeFi is not the same as the 2017 ICO craze. Back then, money was raised on shitcoin white papers written in a coffee shops. DeFi is already live and working in the wild. Billions of dollars are at work earning positive yield. This isn’t hypothetical vaporware, this is real.
— Cameron Winklevoss (@cameron) September 22, 2020
Decentralized finance is a fast-growing segment in the cryptocurrency space. DeFi gives investors the chance to earn yield in exchange for providing liquidity to the market. It is a market that has been defined by its erratic movements that produce both high returns and sudden losses. For instance, some DeFi assets like Airswap, Kava and Nectar tumbled by 40% in the last 30 days.
Reflecting on these erratic movements, Diginex CEO Richard Byworth had compared the ongoing DeFi boom to the ICO craze in 2017. He was not the only one who made this comparison. Messari’s Ryan Watkins had also compared DeFi’s recent market pullback to that of ICOs in 2017, saying “bull markets never go up in a straight line.”
The last couple weeks in DeFi have been an absolute bloodbath.
— Ryan Watkins (@RyanWatkins_) September 22, 2020
But keep in mind bull markets never go up in a straight line.
In the 2017 ICO boom ETH pulled back 20%+ seven times before it peaked in January 2018.
So far in this bull market we’ve only experienced one.
1/ pic.twitter.com/EXqhmm2MkM
ETH/USD daily chart
-637366068222007341.png)
ETH/USD has dropped slightly from $349.15 to $345.35 in the early hours of Friday. The price failed to break above the $389 resistance line a week back, having charted the double top pattern. Since then, the price has dropped to the $320 support level. Following that, it managed to break above the descending triangle formation. As of now, the price is sitting above the downward trending line.
ETH/USD 12-hour chart
-637366068616165848.png)
In the 12-hour price range, the second-largest coin by market cap bounced up from the $320 support line and broke above the SMA 200 curve and the ascending triangle formation. The price has now encountered resistance at the $350 line and fallen down.
ETH/USD 4-hour chart
-637366072262887641.png&w=1536&q=95)
The price bounced up from the $320 line in the hourly chart and managed to do six consecutive bullish sessions, forming a flag pattern. To continue this bullish momentum, ETH needs to bounce back up from the upward trending line and break above the $350 resistance line.
ETH IOMAP
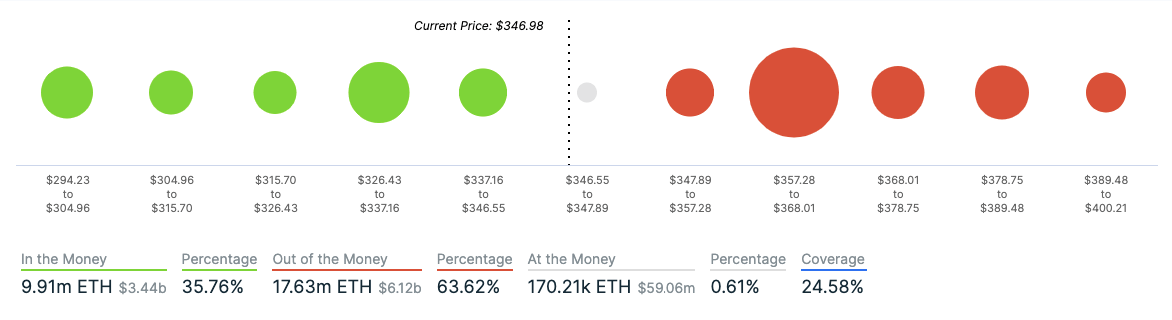
The price is sandwiched between two moderate-to-weak resistance and support levels at $352 and $342. If the price does break past either of these levels, they will next encounter a strong resistance and support level. As such, it’s difficult to see ETH making any sharp movements any time soon.
ETH on-chain
New addresses
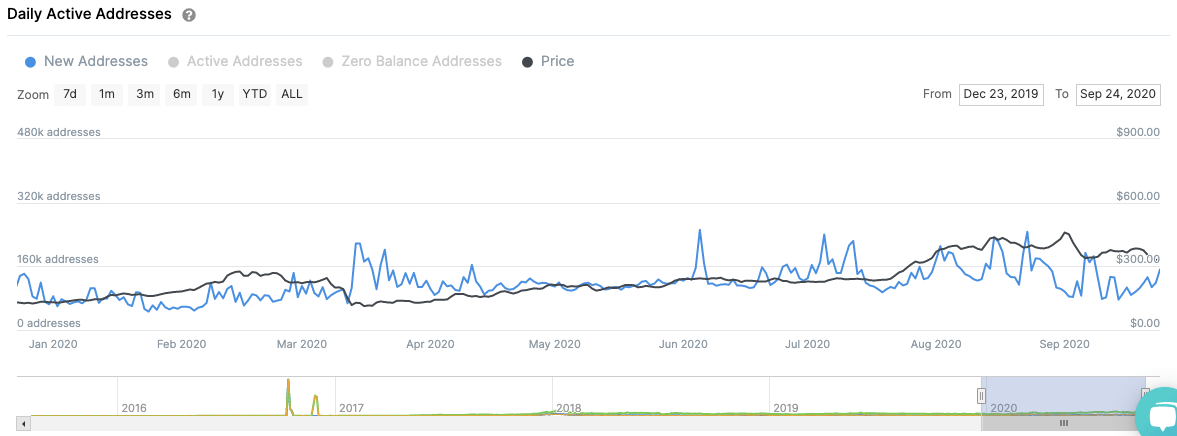
New addresses entering Ethereum reached a 7-month low on September 10, 2020, when just 77.88k new addresses entered the ecosystem. However, that number has steadily increased since then. New addresses entering the system are a very healthy metric since they show that the network is extremely healthy. As of press time, 152k new addresses had entered the Ethereum network.
Key levels
Author

Rajarshi Mitra
Independent Analyst
Rajarshi entered the blockchain space in 2016. He is a blockchain researcher who has worked for Blockgeeks and has done research work for several ICOs. He gets regularly invited to give talks on the blockchain technology and cryptocurrencies.


