Ethereum Price Analysis: ETH at a crossroads as red flags emerge
- Ethereum price discovers resistance at the 50-day simple moving average (SMA) after notable rebound from the May 23 low.
- February 20 high needs to hold any further weakness that may materialize moving forward.
- ETH on-chain metrics create a mixed outlook for the digital asset, suggesting that the timing is not right for a rally continuation.

Ethereum price is struggling to recover the relative strength that dominated the April-May period, as the response to last week’s 41.44% decline has been muted. Until ETH can motivate sustainable price traction above the 50-day SMA and the double bottom trigger, the smart contract giant will be dominated by bewildered price action.
Ethereum price strength fundamental to a broader recovery for the crypto market
Ethereum price rallied almost 60% from the May 19 low at $1,900 into the May 20 high at $2,999 before falling to a new correction low on May 23 at $1,728. A 70% bounce followed the new low to the May 26 high.
A bullish hammer candlestick on the 12-hour ETH chart initiated the rebound on May 23 after printing an oversold reading on the daily Relative Strength Index (RSI). It was accompanied by above-average volume. Moreover, the May 23 undercut of the May 19 low has established a double bottom pattern with a trigger price of $3,000.
The consecutive sharp rebounds have frustrated the bearish narrative and built-up price compression that needs to be released through pullbacks, such as the previous three days. Once complete, Ethereum price may be unfettered to test the double bottom trigger price.
A breakout above the double bottom trigger of $3,000 will quickly reach resistance at the 61.8% Fibonacci retracement of the May correction at $3,369. If the rally continues, Ethereum price will identify minor resistance at the 78.6% retracement at $3,815 before ETH is propelled to the all-time high at $4,384.
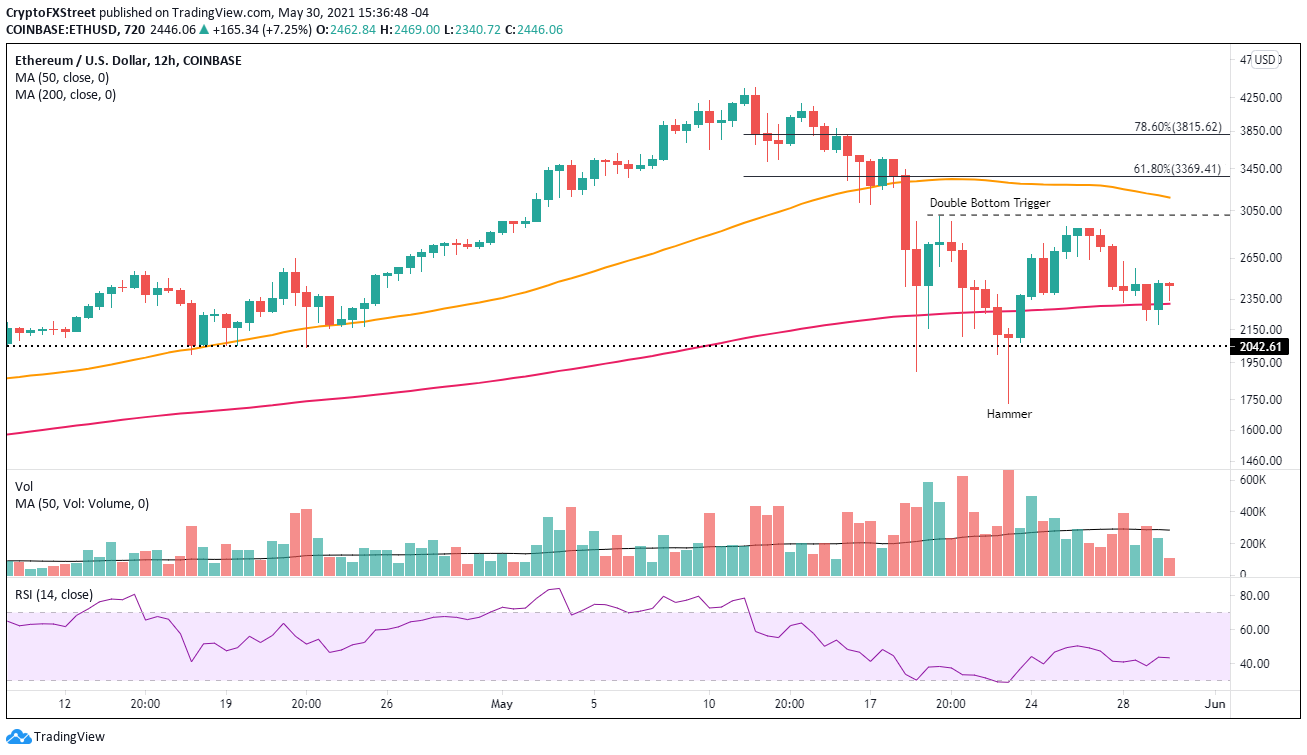
ETH/USD 12-hour chart
Ethereum price could lose the grip on the support framed by the 200 twelve-hour SMA at $2,318, risking a new test of the February high of $2,042. A daily close below the imposing level will downgrade the outlook to negative and raise the probability that ETH will sell down to the strategically important 200-day SMA at $1,657. Prominent investors and the growing number of institutions should be motivated to use the level to begin accumulating in size.
On-chain metrics question a bullish narrative
Based on the IntoTheBlock In/Out of the Money Around Price (IOMAP), there is a cluster of resistance (out of the money) above the current price that includes 182.94k addresses holding 6.88 million ETH at an average price of $2,527. It is followed by another cluster of 379.52k addresses holding 3.39 million ETH at an average price of $2,582.
In terms of support (in the money), there is marginal protection down to the February high of $2,042, supporting a case for another test of the pivotal support.
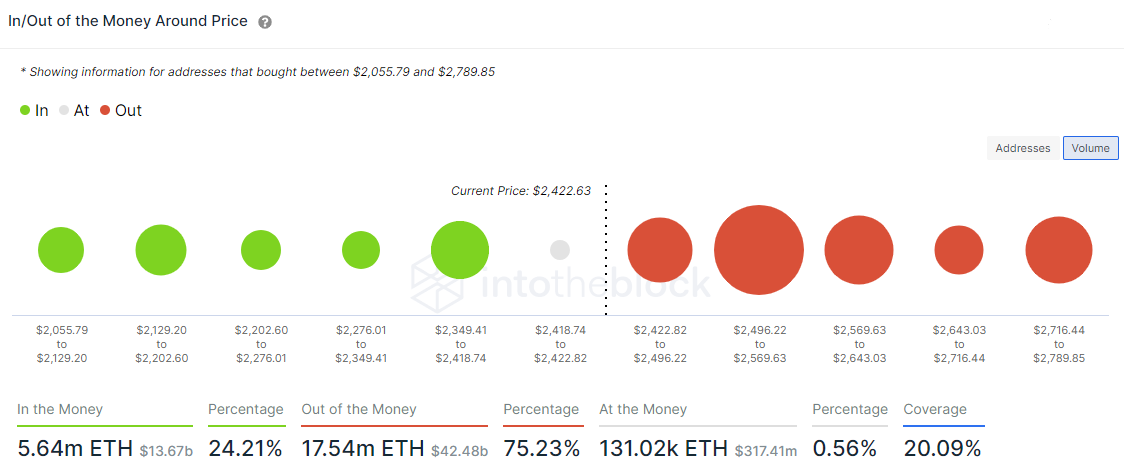
ETH IOMAP
The Santiment 30-day Market Value Realized Value (MVRV) metric does show a negative reading, indicating that Ethereum is undervalued at the current price levels. However, in terms of opportunity, the 30-period moving average remains in the overvalued range. In the past, the 30-period moving average has declined to at least fairly valued, and more often, undervalued before a sizeable rally developed.
Before taking a position, it would be opportunistic to wait for the moving average to reach fair to undervalued levels and then for the 30-day MVRV metric to rise above the moving average. ETH still needs weakness and time to create a similar buy signal.
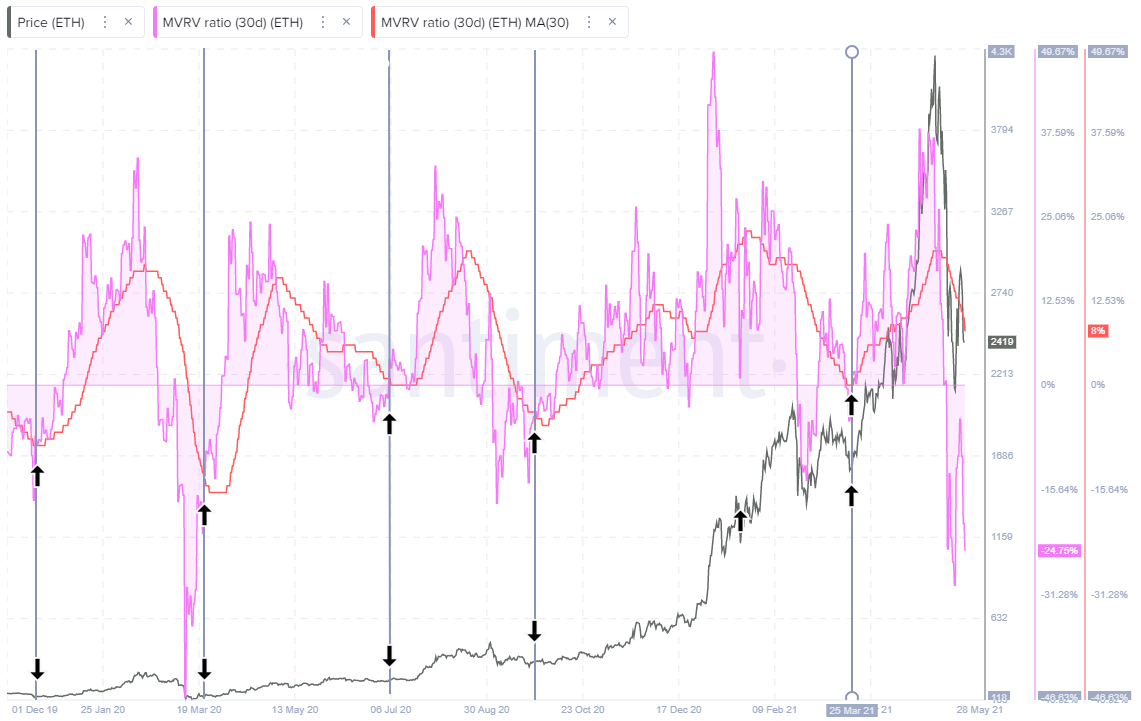
ETH 30-day MVRV
ETH is at a crossroads as the IOMAP data implies that Ethereum price faces significant resistance at current levels. A continuation of the pullback is a high probability in the short term. Meanwhile, the MVRV metric moving average is not near previous levels that coincided with important rallies. A further price retreat would put the MVRV metric moving average at levels consistent to prior lows, thereby establishing an actionable timing signal for the cryptocurrency.
Author

Sheldon McIntyre, CMT
Independent Analyst
Sheldon has 24 years of investment experience holding various positions in companies based in the United States and Chile. His core competencies include BRIC and G-10 equity markets, swing and position trading and technical analysis.


