Ethereum Market Outlook: ETH 2.0 testnet and skyrocketing transaction fees update, ETH/USD bounces up from SMA 50
- The testing of Ethereum’s long-awaited network upgrade is ongoing and could reportedly be nearing its final stages.
- By the end of June, the Onyx testnet was reportedly running stable with more than 20,000 validators.
- Ethereum has seen a surge in the network usage due to the recent boom in the DeFi space.
- The daily median gas price has crossed 50 Gwei, five times higher than the cost in April.
- Some experts believe high transaction fees could lead to Ethereum’s downfall in the longer run.

Ethereum 2.0 testnet
According to some network devs, the testing of Ethereum 2.0 could be nearing its final stages. ETH 2.0’s phase 0 has been running full nodes on the Topaz testnet for a few months. However, the first block on the Beacon Chain has been mined and validated in April. The first testnet, dubbed Sapphire, was a scaled-down version that successfully tested smaller 3.2 ETH deposits.
In May, Topaz went live with testing full 32 ETH nodes, and later in June, the Onyx testnet was unveiled. Prysmatic Labs, who have been conducting a lot of the testing, noted that Onyx was running stable with more than 20,000 validators by late June. The next stage in the process was the launch of the Altona coordinated, the multi-client testnet for Phase 0 in early July. Altona's goal is to ensure some stability before there is an official announcement of a large scale, “official” multi-client testnet for ETH 2.0, as per a CryptoPotato report.
According to some leaked commentary among ETH devs on their Discord channel, the final testnet is around the corner. Ethhub co-founder, Anthony Sassano, took to Twitter to share the comments.
The final planned eth2 phase 0 testnet is going live very soon
— Anthony Sassano | sassal.eth (@sassal0x) July 17, 2020
h/t @AlexanderFisher pic.twitter.com/KQ7VjUA6hz
In a recent blog post, Prysmatic Labs revealed that there had been some technical hiccups with block propagation and the blockchain package, which are currently being worked on. Developer Afri Schoedon, who coordinates the ETH 2.0 multi-client testnet, recently posted some client metrics on Twitter.
Ethereum 2.0 Client Metrics 07/2020 are out! pic.twitter.com/LUORWmbphe
— Afr Schoe (@q9fmz) July 17, 2020
ETH transaction fees skyrocket by 500% since April
Due to the recent boom in the decentralized finance (DeFi) sector, Ethereum has witnessed a surge in the number of active addresses, users and transactions. However, this spike in network usage has come with a cost. According to the analytics company Glassnode, the daily median gas price of an ETH transaction has crossed 50 Gwei, five times higher than the transaction cost in April. This also marks the highest reading in almost two years.
#Ethereum gas prices continue to rise.
— glassnode (@glassnode) July 17, 2020
The daily median gas price has increased by more than 5x since April, surpassing 50 Gwei yesterday for the first time in almost 2 years.
Live chart: https://t.co/jAzTVXZoVy pic.twitter.com/nN2ToIOuZE
A few analysts believe that the high transaction fees could lead to Ethereum’s downfall in the longer run. Qiao Wang, a former head of product at Messari, said that until Ethereum 2.0 is fully launched, there’s a big opportunity for highly-scalable blockchains to take over Ethereum. He added that paying $10 transaction fee and waiting 15 seconds for settlement “is just bad UX.”
Wang is not the only one who believes that Ethereum’s gas prices threaten ETH's viability as an asset. According to a Bitcoinist report, Exponential Investments’ CIO and VP of Portfolio Management, Steven McClurg and Leah Wald said:
The issues inherent in gas costs have created congestion, which is a negative network externality. Congestion on Ethereum has led to poor user experience, especially for traders in this highly volatile environment, as their leveraged positions may be liquidated before they can act.
American businessman Joseph Todaro has echoed this sentiment as well. He wrote that as transaction fees increase, “scalability will raise its ugly head once again.” He added that it is time to look at the neglected ETH competitors.
ETH/USD daily chart
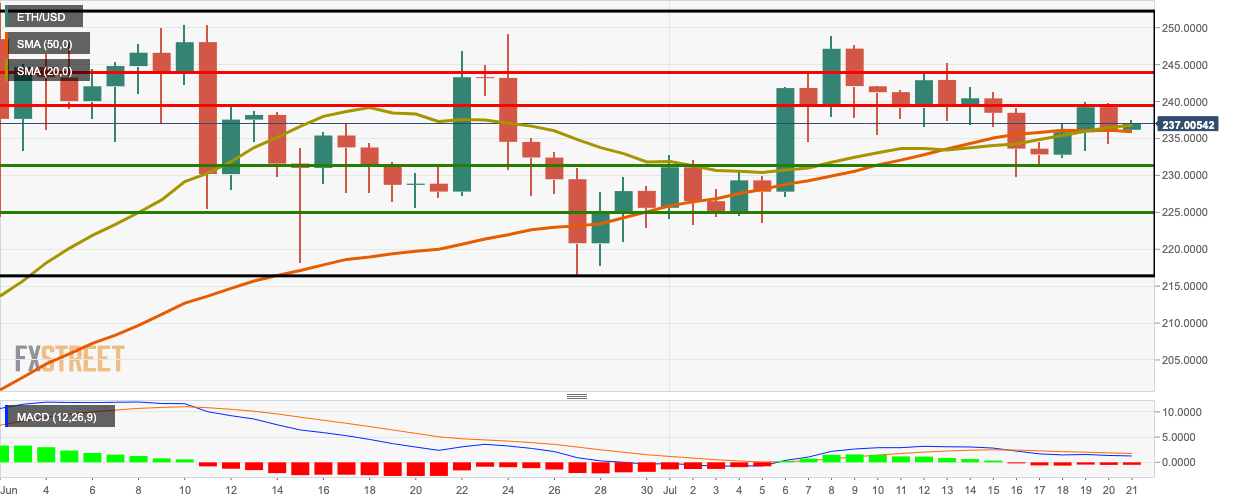
ETH/USD bulls made a comeback this Tuesday after bouncing up from the SMA 50 curve. The price has gone up from $236.16 to $237, crossing the SMA 20 curve in the process. The MACD shows negative market momentum.
The bulls face strong resistance at $239.45 and $244. On the downside, healthy support lies at $236 (SMA 20), $235.80 (SMA 50), $231.20 and $225.15.
Key levels
Author

Rajarshi Mitra
Independent Analyst
Rajarshi entered the blockchain space in 2016. He is a blockchain researcher who has worked for Blockgeeks and has done research work for several ICOs. He gets regularly invited to give talks on the blockchain technology and cryptocurrencies.


