- Cardano price failed to sustain its uptrend, resulting in a 37% correction over the past month.
- ADA could crash 20% to $0.80 if the $1 psychological level fails to hold up.
- A daily candlestick close above the 50-day SMA at $1.20 will be the start of a potential upswing.
Cardano price has been on a downswing for the past month and has revisited a crucial support level twice in this range. A breakdown of this barrier could lead to a steep correction to levels last seen a year ago.
Cardano price faces a decisive moment
Cardano price set up a higher high at $1.64, coinciding with the 100-day Simple Moving Average (SMA) on January 18. Since then, ADA has been on a downtrend and revisited the $1 level twice in the past month.
As the so-called “Ethereum killer” tags the $1 barrier again, the possibility of a breakdown increases. Moreover, a double bottom and a sell-side liquidity zone at $0.803 make it more appealing for market makers to knock the altcoin lower.
Therefore, investors need to exercise caution and be prepared for a downswing. In an optimistic scenario, a resurgence of buyers could see Cardano price hold its ground around the $1 support level and consolidate before rethinking the directional bias.
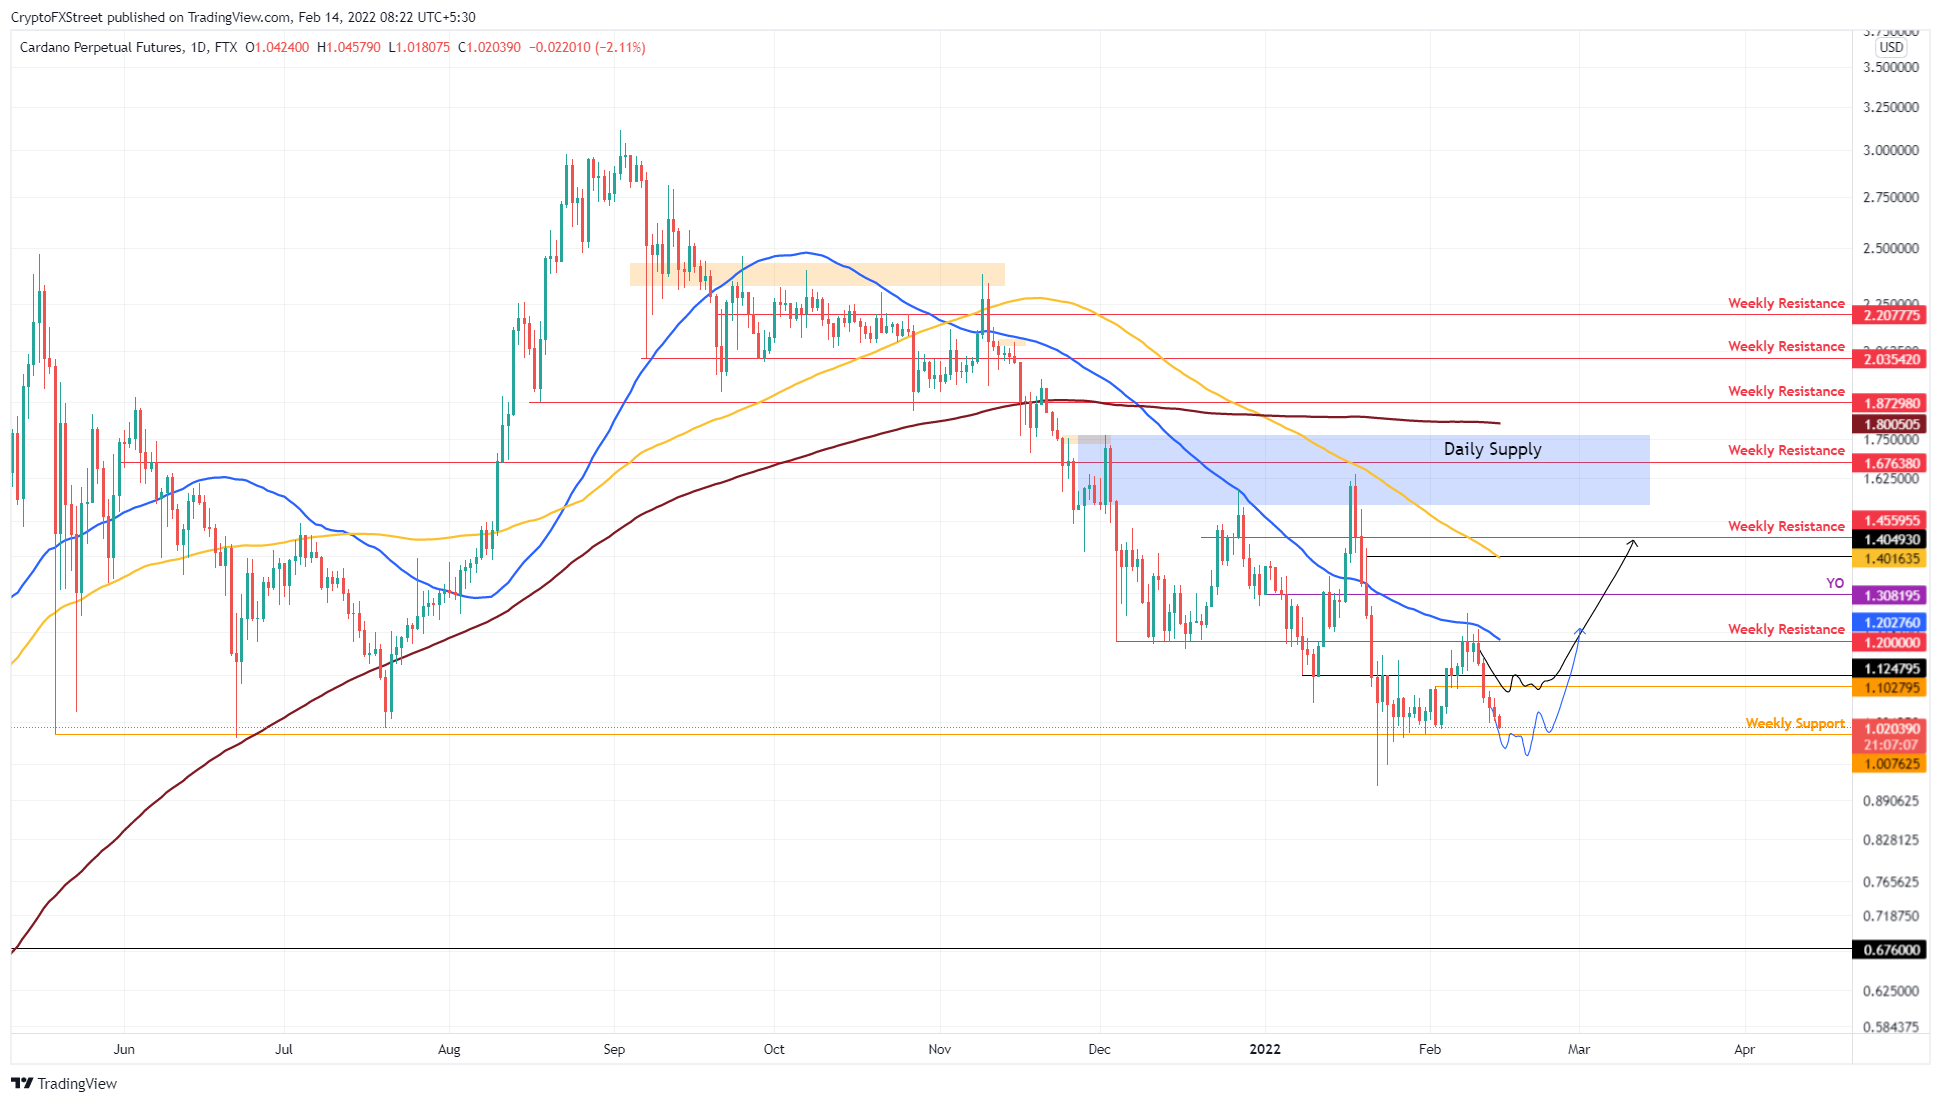
ADA/USDT 1-day chart
Further depicting the grim nature of Cardano price is IntoTheBlock’s Global In/Out of the Money (GIOM) model. This on-chain index suggests that failing to hold above a significant support level at $1 could see ADA revisit the support cluster at $0.90, where roughly 53,070 addresses purchased 452.53 million tokens. This level is relatively weak and is likely to be breached quickly should the price ever revisit this area.
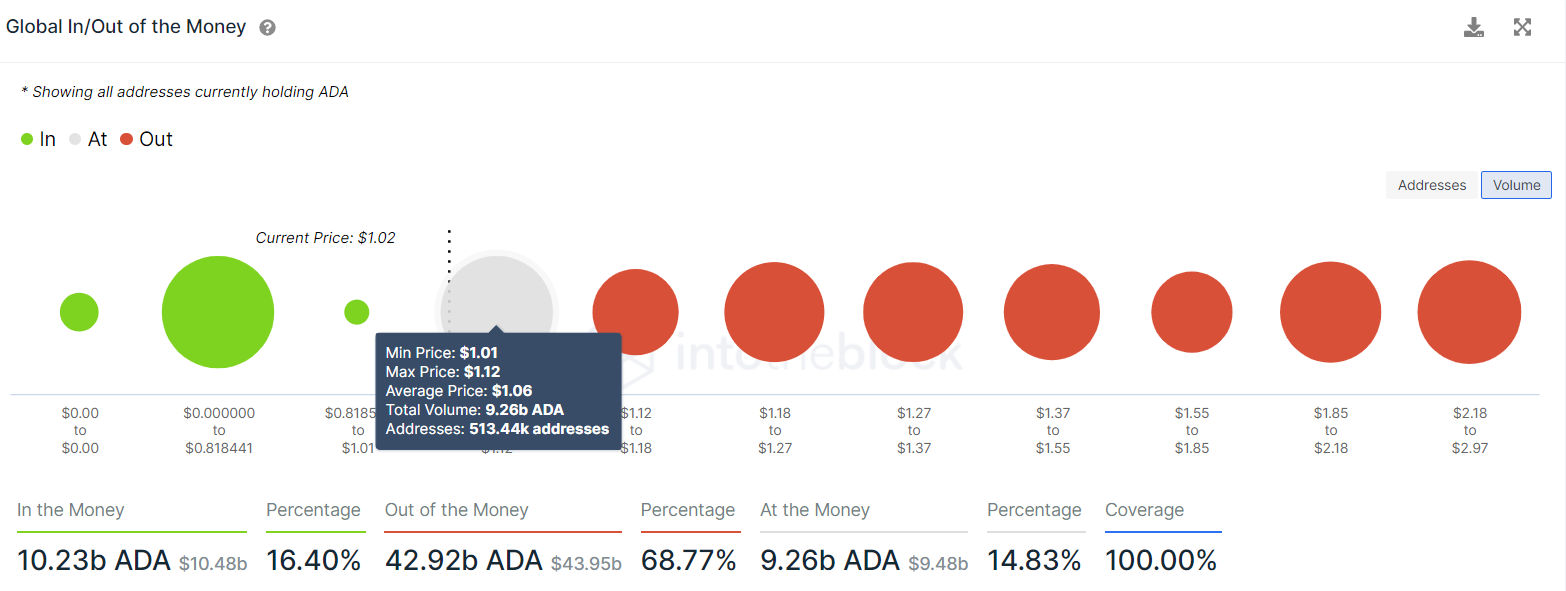
ADA GIOM
This reduction in the number of large transactions worth $100,000 or more from 3,620 to 2,050 aligns perfectly with the recent downswing in Cardano price. The 43% slump suggests that high networth investors are losing interest in Cardano at the current price levels.
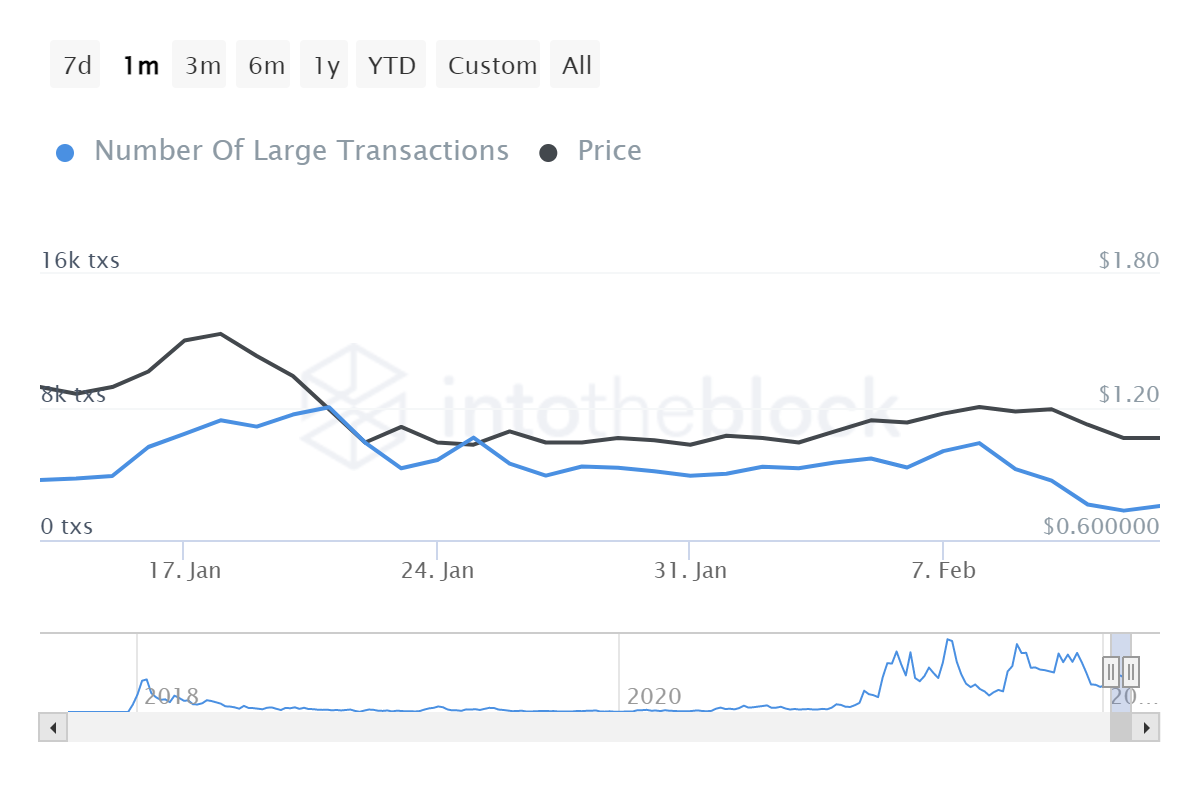
ADA large transactions
While things look grim for Cardano price, a bounce off the $1 barrier could trigger a massive uptrend if buyers band together. If this upswing pushes ADA to produce a daily candlestick close above $1.20 or the 50-day SMA, it will signal the potential start of an uptrend.
Information on these pages contains forward-looking statements that involve risks and uncertainties. Markets and instruments profiled on this page are for informational purposes only and should not in any way come across as a recommendation to buy or sell in these assets. You should do your own thorough research before making any investment decisions. FXStreet does not in any way guarantee that this information is free from mistakes, errors, or material misstatements. It also does not guarantee that this information is of a timely nature. Investing in Open Markets involves a great deal of risk, including the loss of all or a portion of your investment, as well as emotional distress. All risks, losses and costs associated with investing, including total loss of principal, are your responsibility. The views and opinions expressed in this article are those of the authors and do not necessarily reflect the official policy or position of FXStreet nor its advertisers. The author will not be held responsible for information that is found at the end of links posted on this page.
If not otherwise explicitly mentioned in the body of the article, at the time of writing, the author has no position in any stock mentioned in this article and no business relationship with any company mentioned. The author has not received compensation for writing this article, other than from FXStreet.
FXStreet and the author do not provide personalized recommendations. The author makes no representations as to the accuracy, completeness, or suitability of this information. FXStreet and the author will not be liable for any errors, omissions or any losses, injuries or damages arising from this information and its display or use. Errors and omissions excepted.
The author and FXStreet are not registered investment advisors and nothing in this article is intended to be investment advice.
Recommended Content
Editors’ Picks
Bitcoin Weekly Forecast: BTC bloodbath continues, near 30% down from its ATH
Bitcoin price extends its decline and trades below $80,000 at the time of writing on Friday, falling over 15% so far this week. This price correction wiped $660 billion of market capitalization from the overall crypto market and saw $3.68 billion in total liquidations this week.
Cardano poised for double-digit drop amid market weakness
Cardano price is extending its decline by nearly 7%, trading around $0.60 on Friday after falling 23% this week. Santiment data support this decline as ADA daily active addresses are falling, and the technical outlook indicates a continued correction, with ADA potentially facing an additional double-digit decline.
XRP short-term holders dominate sell-off as whales buy the dip
XRP short-term holders dominated the selling activity during the recent market crash. XRP whales have been accumulating more tokens during the crash, adding over $1 billion worth of tokens. XRP could bounce off the lower boundary of a descending channel if it fails to hold the $1.96 support level.
Top 3 Price Prediction Bitcoin, Ethereum, Ripple: BTC, ETH and XRP continue to sell off
Bitcoin (BTC) price continues declining on Friday after falling more than 15% this week. Ethereum (ETH) and Ripple (XRP) followed BTC’s footsteps and declined by nearly 24% and 21%, respectively.
Bitcoin: BTC bloodbath continues, near 30% down from its ATH
Bitcoin (BTC) price extends its decline and trades below $80,000 at the time of writing on Friday, falling over 15% so far this week. This price correction wiped $660 billion of market capitalization from the overall crypto market and saw $3.68 billion in total liquidations this week.
The Best brokers to trade EUR/USD
SPONSORED Discover the top brokers for trading EUR/USD in 2025. Our list features brokers with competitive spreads, fast execution, and powerful platforms. Whether you're a beginner or an expert, find the right partner to navigate the dynamic Forex market.