Ethereum ETH Technical Analysis: ETH/USD surges out from a descending channel
- Ethereum was licking its wounds with losses of just 2.2%, after starting the session initially firmly on the back foot.
- ETH/USD price action had formed a descending channel formation, which has since seen a decent breakout to the upside.
- A broader recovery seen across the market, sustainability is however in question.
- Short term views the price was oversold, however more long-term, there is potentially still room for downside.

ETH/USD 60-minute chart
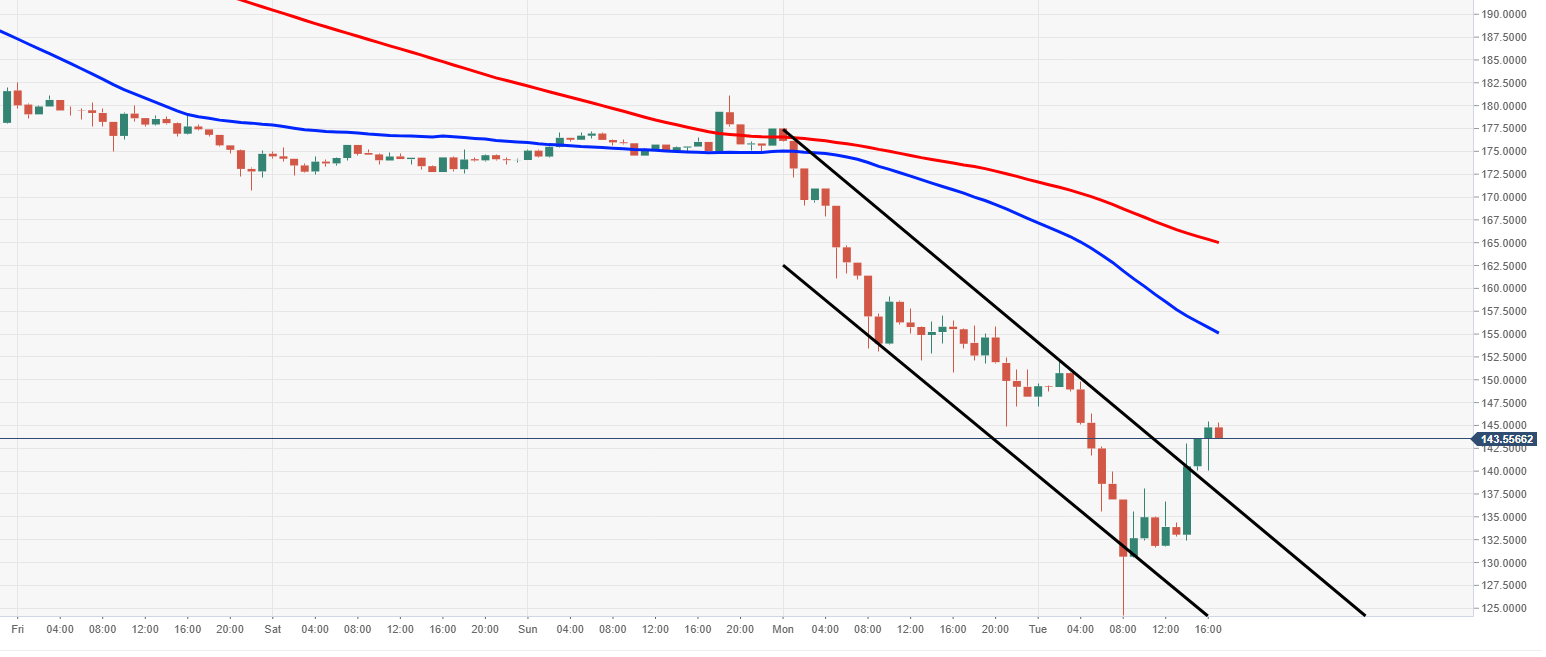
Spot rate: 144.15
Relative change: -2.25%
High: 177.10
Low: 144.94
Trend: Bearish
Support 1: 136.21, daily pivot point support.
Support 2: 124.28, daily pivot point support. .
Support 3: 103.62, daily pivot point support.
Resistance 1: 168.81, daily pivot point resistance.
Resistance 2: 189.46, daily pivot point resistance.
Resistance 3: 201.40, daily pivot point resistance.
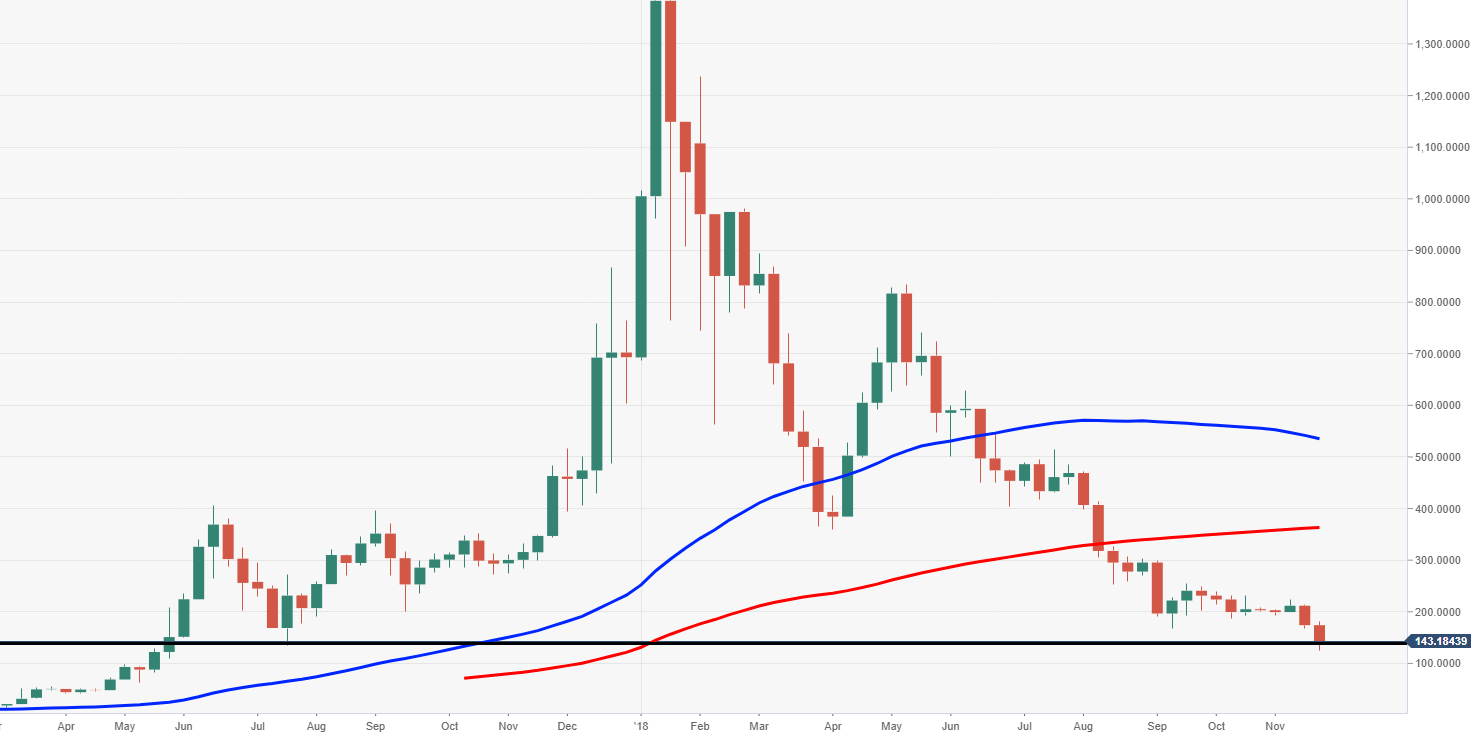
ETH/USD weekly chart
- Looking via the weekly chart view, price action is testing a vital weekly support. Levels not seen since July 2017.
Author

Ken Chigbo
Independent Analyst
Ken has over 8 years exposure to the financial markets. He started his career as an analyst, covering a variety of asset classes; forex, fixed income, commodities and equities.


