|

Ethereum (ETH) meltdown ends: Is this the bottom?

  • Ethereum prices descends to levels slight above $120 in yet another crypto selloff.
  • For the first time, the 21 SMA drops below the 50 SMA on the weekly range.

Most cryptocurrency traders detest words such as meltdown, carnage and bloodbath. It is because sometimes these terms exaggerate the situation in the market. However, the status quo in the crypto market on Tuesday deserves all these terms. In I do not think they show the real picture of the bloody market we have today.

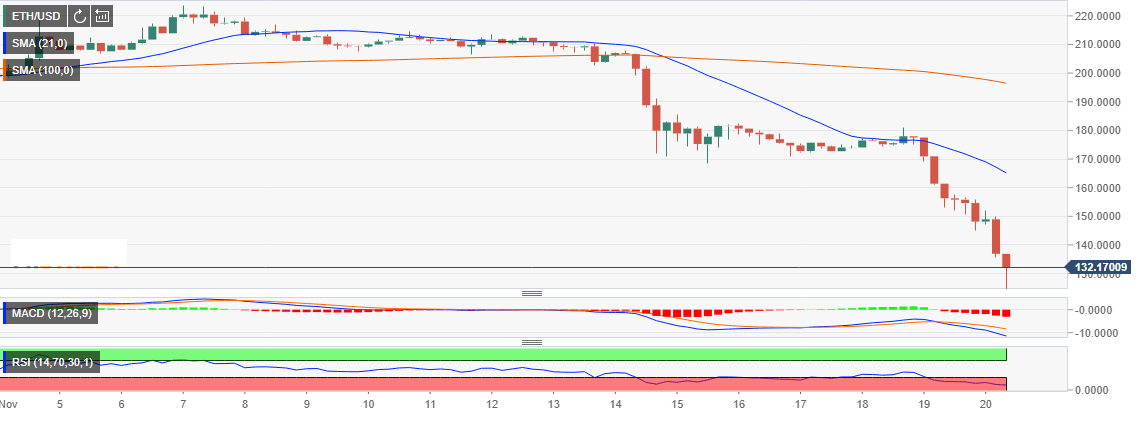
Ethereum has not been able to break from the downward trend since it traded highs close to $1,400 in January 2018. Consequently, the weekly chart shows that for the first time, the 21 SMA has crossed below the 50 SMA. At the time of writing Ethereum price has plunged 9.27% after it slipped below $150. The price has recorded lows of $124.25 on the day but has corrected above $130.

Indicators on a 4-hour range show that the slope is not over and Ethereum could resume the trend towards $100. The MACD is moving further into the negative territory since the drop below the mean line started on November 10th. At the moment, the MCAD is at -11.42, likewise the RSI indicates that ETH/USD has reached the oversold levels and therefore trading below its market value. A recoil is needed immediately before the bears drag the third digital asset by market capitalization below $100.

ETH/USD 4-hour chart

Get 24/7 Crypto updates in our social media channels: Give us a follow at @FXSCrypto and our FXStreet Crypto Trading Telegram channel

Author

John Isige

John Isige

FXStreet

John Isige is a seasoned cryptocurrency journalist and markets analyst committed to delivering high-quality, actionable insights tailored to traders, investors, and crypto enthusiasts. He enjoys deep dives into emerging Web3 tren

More from John Isige
Share:

Editor's Picks

Bitcoin Cash trades lower, risks dead-cat bounce amid bearish signals

Bitcoin Cash (BCH) trades in the red below $522 at the time of writing on Tuesday, after multiple rejections at key resistance. BCH’s derivatives and on-chain indicators point to growing bearish sentiment and raise the risk of a dead-cat bounce toward lower support levels.

Pump.fun Price Forecast: PUMP weakens amid 10 billion token unlock, low retail interest

Pump.fun (PUMP) edges lower by roughly 2% at the time of writing on Tuesday, extending Monday’s 4% drop. The launchpad token remains at downside risk as 10 billion PUMP will unlock on Tuesday, while retail interest is declining.

Hyperliquid Price Forecast: HYPE consolidates as traders show mixed sentiment

Hyperliquid (HYPE) price is trading sideways at the time of writing on Tuesday, reflecting market indecision as traders await a clearer directional signal. The derivatives data further supports this mixed sentiment, with rising short bets while funding rates remain positive. 

Top Crypto Gainers: World Liberty Financial, MemeCore and Quant gain momentum

World Liberty Financial, MemeCore, and Quant are leading gains over the last 24 hours as the broader cryptocurrency market stabilizes after last week’s correction. Still, the technical outlook for altcoins remains mixed due to prevailing downside pressure and vulnerable market sentiment. 

Bitcoin Price Annual Forecast: BTC holds long-term bullish structure heading into 2026

Bitcoin (BTC) is wrapping up 2025 as one of its most eventful years, defined by unprecedented institutional participation, major regulatory developments, and extreme price volatility.

Bitcoin: The worst may be behind us

Bitcoin (BTC) price recovers slightly, trading at $65,000 at the time of writing on Friday, after reaching a low of $60,000 during the early Asian trading session. The Crypto King remained under pressure so far this week, posting three consecutive weeks of losses exceeding 30%.