Ethereum's price failed to react to ETH ETFs successful launch
- Ethereum ETFs are on track for a successful second trading day after capturing $107 million in net inflows on launch day.
- Investors shifted attention toward ETH as its impressive first-day launch ended BTC ETFs' 12 days of consecutive net inflows.
- Ethereum price structure and options data indicate a potential brief decline before a bullish reversal.

Ethereum's (ETH) price is down 1.8% on Wednesday despite an impressive ETH ETFs' first-day launch that saw them attract $10.2 billion in assets and net inflows of $107 million.
Daily digest market movers: ETH ETFs vs Bitcoin ETFs
Ethereum ETFs are on track for a second successful trading day after an impressive first-day launch.
In their first day of trading, ETH ETFs raked in $10.2 billion in assets across the nine ETFs that debuted and over $1.1 billion in trading volume. The total net flows across the products were around $107 million after accounting for the massive $484 million outflows witnessed in Grayscale's ETHE.
Bloomberg analyst James Seyffart noted that ETHE experienced higher first-day outflows compared to Grayscale's GBTC because it was already trading at net asset value (NAV) upon launch. GBTC, on the other hand, was trading at a discount when BTC ETFs launched, reducing the selling pressure from holders.
When compared against Bitcoin, ETH ETFs only managed to attract 16% of BTC ETFs' $655 million first-day net flows. However, Bitwise's Juan Leone noted that ETH ETFs captured 79% of BTC ETF flows when outflows from ETHE/GBTC were excluded. With such a move, ETH ETFs may be on track to surpass analysts' earlier estimates of $3 billion to $5 billion net flows in the first six months of launch.
However, the inflow effect isn't yet visible in ETH's price despite the heavy buying from asset managers. A possible reason is the outflows from ETHE canceling out the demand pressure from other asset managers.
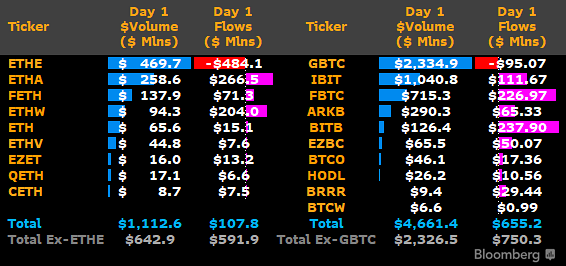
Bloomberg Ethereum ETFs
Meanwhile, while ETH ETFs experienced inflows yesterday, BTC ETFs suffered outflows, ending their streak of 12 consecutive days of net inflows. It appears ETH ETFs are stealing attention from the largest digital asset.
ETH Technical Analysis: Why Ethereum's price is poised for a brief drop
Ethereum is trading around $3,420 on Wednesday, down 1.8% on the day. ETH 24-hour liquidation is at $14.15 million, with long and short liquidations accounting for $8.66 million and $5.49 million, respectively, according to Coinglass data.
ETH Long/Short Ratio declined to 0.91 in the past 24 hours, indicating bearish sentiment still prevails over bulls in the market.
ETH's decline is similar to that of Bitcoin when BTC launched in January. Using the price of BTC as a proxy, ETH may see a bullish reversal to a new all-time high after a brief decline. This is also visible in ETH's daily chart, which shows signs that the largest altcoin could decline toward the $3,203 support before bouncing to attack the $3,731 key resistance.
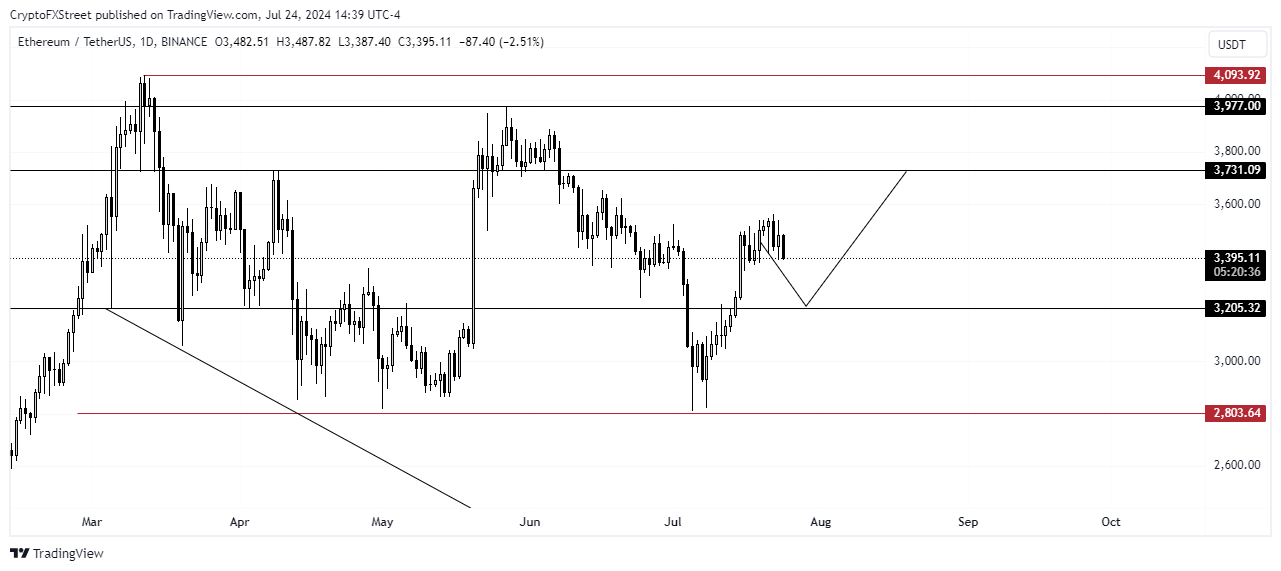
ETH/USDT Daily chart
Deribit's options data aligns with the thesis above, as the Put/Call Ratio (PCR) for the August 9 ETH options expiry surged to 1.19. This suggests that most traders are betting for a similar BTC post-ETF decline to happen with ETH, leading to a potential self-fulfilling prophecy.
Long-dated PCR is at 0.3, with open interest concentrated around the strike prices of $4,000 and $5,000, indicating a long-term bullish sentiment among traders.
The thesis will be invalidated if ETH sustains an extended decline below the $3,203 support level.
In the short term, ETH could retest the $3,500 psychological level, at which $45 million worth of short positions risk liquidation, as prices will likely move towards a zone with a high concentration of potential liquidation levels.
Bitcoin, altcoins, stablecoins FAQs
Bitcoin is the largest cryptocurrency by market capitalization, a virtual currency designed to serve as money. This form of payment cannot be controlled by any one person, group, or entity, which eliminates the need for third-party participation during financial transactions.
Altcoins are any cryptocurrency apart from Bitcoin, but some also regard Ethereum as a non-altcoin because it is from these two cryptocurrencies that forking happens. If this is true, then Litecoin is the first altcoin, forked from the Bitcoin protocol and, therefore, an “improved” version of it.
Stablecoins are cryptocurrencies designed to have a stable price, with their value backed by a reserve of the asset it represents. To achieve this, the value of any one stablecoin is pegged to a commodity or financial instrument, such as the US Dollar (USD), with its supply regulated by an algorithm or demand. The main goal of stablecoins is to provide an on/off-ramp for investors willing to trade and invest in cryptocurrencies. Stablecoins also allow investors to store value since cryptocurrencies, in general, are subject to volatility.
Bitcoin dominance is the ratio of Bitcoin's market capitalization to the total market capitalization of all cryptocurrencies combined. It provides a clear picture of Bitcoin’s interest among investors. A high BTC dominance typically happens before and during a bull run, in which investors resort to investing in relatively stable and high market capitalization cryptocurrency like Bitcoin. A drop in BTC dominance usually means that investors are moving their capital and/or profits to altcoins in a quest for higher returns, which usually triggers an explosion of altcoin rallies.
Author

Michael Ebiekutan
FXStreet
With a deep passion for web3 technology, he's collaborated with industry-leading brands like Mara, ITAK, and FXStreet in delivering groundbreaking reports on web3's transformative potential across diverse sectors. In addi


