Ethereum ETF inflows and low CPI could help ETH stage rally amid Jump Crypto headwind
- Ethereum ETFs record second consecutive day of inflows amid in-line CPI data.
- Jump Trading moves over $46 million worth of ETH in what may be another dump.
- Key trendline holds strong after rejecting Ethereum's upward move.

Ethereum (ETH) is down 1.7% on Wednesday as low Consumer Price Index (CPI) inflation data and rising ETH ETF inflows hint that a rally may be imminent. However, a key trendline suggests ETH may repeat history by consolidating for a few weeks before beginning a fresh upward move.
Daily digest market movers: Low CPI, Ethereum ETF inflows, Jump Crypto potential ETH sale
The US Consumer Price Index (CPI) declined to 2.9% YoY, below the expected value of 3.0, according to data from the Bureau of Labor Statistics (BLS). Following the decline, the probability of the Federal Reserve (Fed) cutting interest rates by 25 basis points on the CME rose to 56.5%.
BREAKING: July CPI inflation rate falls to 2.9%, below expectations of 3.0%.
— The Kobeissi Letter (@KobeissiLetter) August 14, 2024
Core CPI inflation fell to 3.2%, in-line with expectations of 3.2%.
This marks the first month with CPI inflation below 3.0% since March 2021.
The first rate cut since 2020 is coming next month.
As a result, Ethereum could see a recovery in the coming weeks as risk assets like cryptocurrencies thrive during a lower interest rate environment.
On the ETF front, Ethereum ETFs recorded net inflows of $24.3 million on Tuesday, marking a second consecutive day of positive flows for the products.
Notably, BlackRock ETHA saw net inflows of $49.1 million, bringing its total inflows since launch to $950.2 million. Also, Fidelity FETH had inflows of $5.4 million. Meanwhile, Grayscale ETHE recorded outflows of $31 million, extending its cumulative outflows to $2.32 billion.
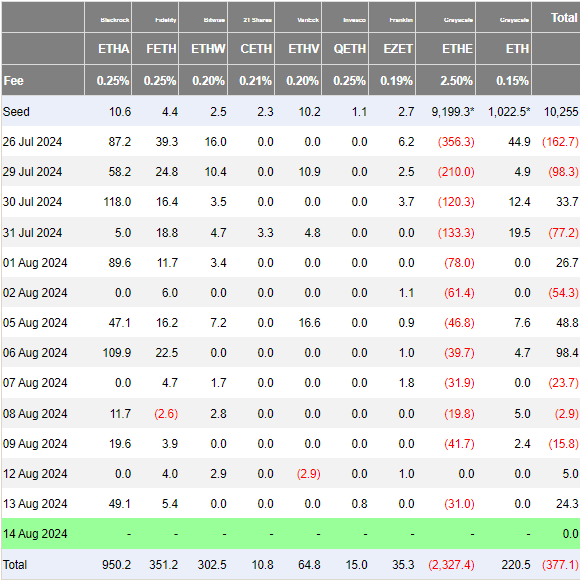
Ethereum ETF Flows
Several crypto community members have expressed sentiment suggesting Ethereum may stage a rally in the coming weeks if the Fed cuts rates and ETH ETF inflows continue.
On the other hand, Jump Trading may be resuming its potential ETH selling spree after claiming 17,049 ETH worth $46.44 million from staking protocol Lido Finance, according to Lookonchain's data. The trading firm still holds $148 million worth of ETH across Lido Finance and another wallet. Jump reportedly began dumping ETH worth over $400 million on August 2.
ETH technical analysis: Ethereum faces rejection around key trendline again
Ethereum is trading around $2,660 on Wednesday, down 1.7% on the day. In the past 24 hours, ETH has seen over $46.27 million in liquidations, with long and short liquidations accounting for $29.44 million and $16.83 million, respectively.
On the daily time frame, Ethereum attempted to cross above the descending trendline beginning from May 27 but saw a rejection around the $2,799 resistance level. The rejection has seen the short-term bearish view from the trendline hold as it suggests ETH could decline to the swing low between $2,000 and $2,100.
As previously discussed, ETH posted similar moves from August 2022 to November 2022 and July 2023 to October 2023. If history repeats, ETH will fail to break the trendline resistance until September.
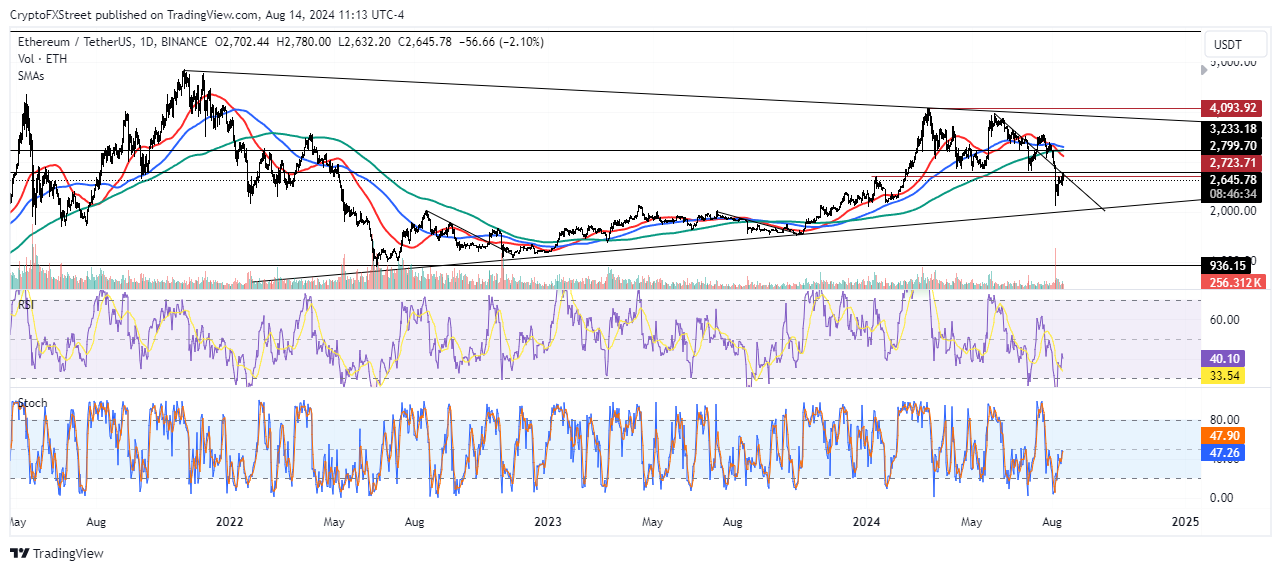
ETH/USDT Daily chart
A successful completion of this move could see ETH stage a fresh rally that follows a three-year bullish triangle that began in late 2021. On the upside, ETH faces resistance around the 100-day and 200-day Simple Moving Averages (SMAs) following a "Death Cross" on August 8. A "Death Cross" is considered a bearish divergence signal and occurs when a lower time frame SMA crosses above that of a higher time frame.
The Relative Strength Index is at 40, tilting toward the downside. This suggests that the market is consolidating with a slight bias toward bears.
A daily candlestick close below the lower side of the triangle may invalidate the short-term bearish-bullish outlook.
In the short term, ETH could decline to $2,621, where there's a liquidation wall of $38.33 million.
Ethereum FAQs
Ethereum is a decentralized open-source blockchain with smart contracts functionality. Serving as the basal network for the Ether (ETH) cryptocurrency, it is the second largest crypto and largest altcoin by market capitalization. The Ethereum network is tailored for scalability, programmability, security, and decentralization, attributes that make it popular among developers.
Ethereum uses decentralized blockchain technology, where developers can build and deploy applications that are independent of the central authority. To make this easier, the network has a programming language in place, which helps users create self-executing smart contracts. A smart contract is basically a code that can be verified and allows inter-user transactions.
Staking is a process where investors grow their portfolios by locking their assets for a specified duration instead of selling them. It is used by most blockchains, especially the ones that employ Proof-of-Stake (PoS) mechanism, with users earning rewards as an incentive for committing their tokens. For most long-term cryptocurrency holders, staking is a strategy to make passive income from your assets, putting them to work in exchange for reward generation.
Ethereum transitioned from a Proof-of-Work (PoW) to a Proof-of-Stake (PoS) mechanism in an event christened “The Merge.” The transformation came as the network wanted to achieve more security, cut down on energy consumption by 99.95%, and execute new scaling solutions with a possible threshold of 100,000 transactions per second. With PoS, there are less entry barriers for miners considering the reduced energy demands.
Author

Michael Ebiekutan
FXStreet
With a deep passion for web3 technology, he's collaborated with industry-leading brands like Mara, ITAK, and FXStreet in delivering groundbreaking reports on web3's transformative potential across diverse sectors. In addi


