Ethereum continues to reign the DeFi market, but TRON’s network activity skyrockets
- Most of the initial DeFi projects were created on top of the Ethereum blockchain in the form of ERC-20 tokens.
- Recently, the team of TRON introduced their own DeFi project with SUN genesis mining.

After the total DeFi market capitalization exploded, surpassing $15 billion, several prominent projects announced the launch of their own DeFi products. TRON was one of the most recent ones to join the DeFi craze with SUN Genesis mining. The idea behind SUN is to become the ‘quintessential Bitcoin equivalent on the TRON network.’
SUN is completely community-driven and an experiment where the community can propose, discuss, vote, and implement proposals. The announcement and launch of SUN mining had a tremendous impact on the price of TRX.
TRON saw a massive 125% price explosion outperforming the entire market and reaching a new two-year high at $0.049.
Ethereum remains the king of the DeFi
Nonetheless, Ethereum is still the king, as most new DeFi projects continuously use the network to build their tokens. According to the most recent DappRadar report, activity on Ethereum increased by 154% in Q3 2020 despite the substantial gas prices.
While some projects have started building their DeFi products on TRON to avoid high gas prices, the overwhelming majority continues using Ethereum given the upcoming ETH 2.0 update.
ETH/USD daily chart
-637370917016400525.png)
Ethereum is currently trading at $356, in between the 50-SMA and the 100-SMA. The MACD indicator turned bullish two days ago. However, the last few bullish crosses resulted in fakeouts. If bulls can get a clear MACD bull cross into a continuation move, we could see similar price action like on July 23 when Ethereum exploded above $250.
ETH IOMAP Chart
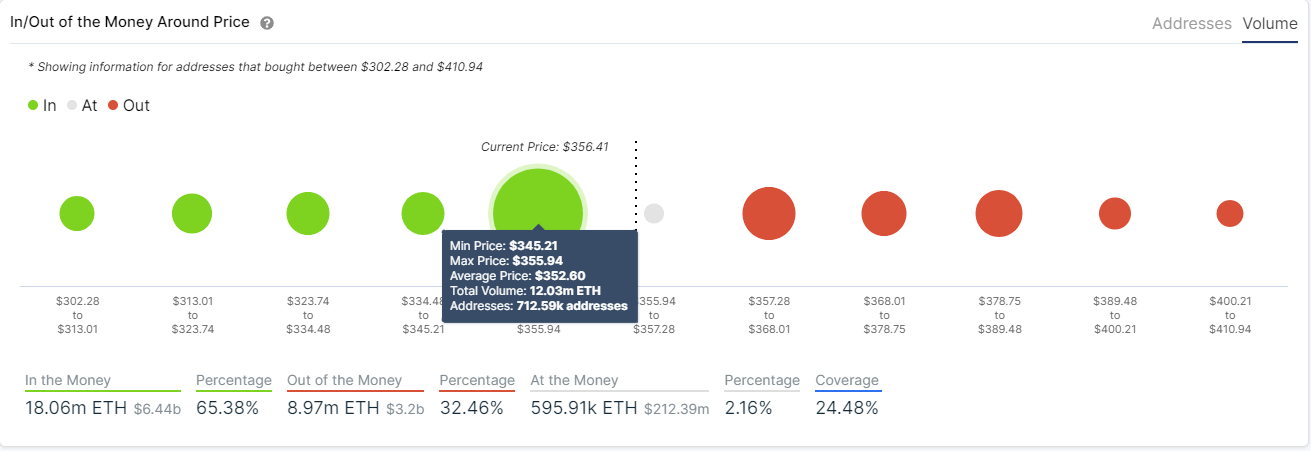
The In/Out of the Money Around Price chart by IntoTheBlock shows a massive support area between $345 and $355. In this range, 700,000 addresses bought 12 million Ethereum coins. In comparison, the resistance area above $357 is far lower, with only 3 million ETH bought between $357 and $368.
ETH New Addresses Chart
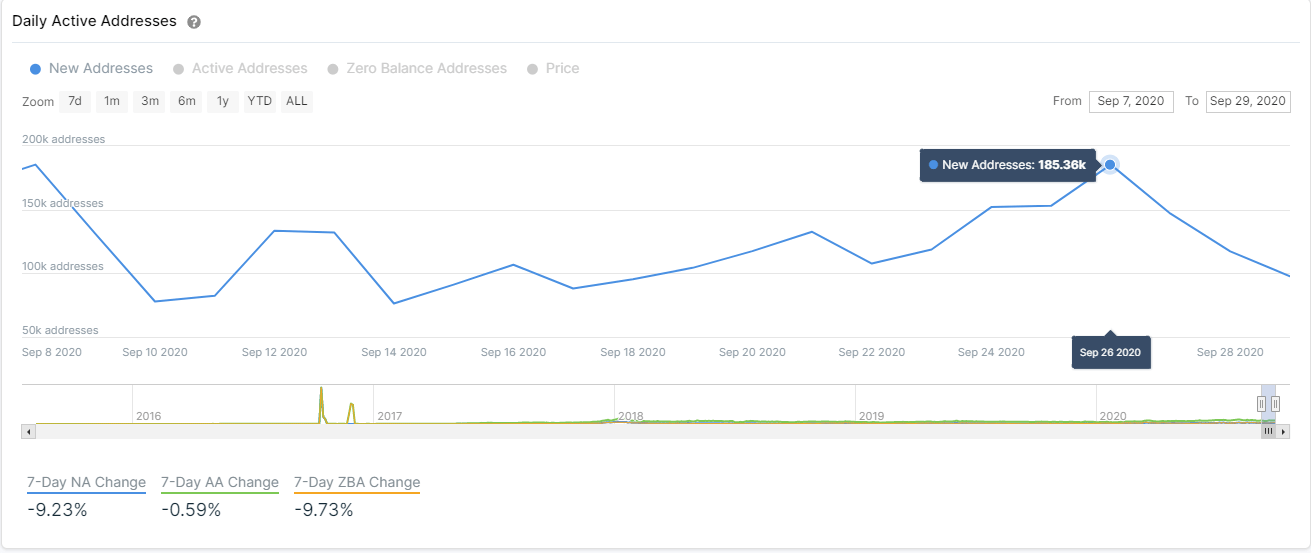
On the other hand, the chart with new ETH addresses entering the network reveals a steep decline from a high of 185,000 on September 26 to a current low of 97,000. This metric suggests that there isn’t much interest behind the most recent Ethereum bounce from $313. A bearish breakout below the support area at $345-355 indicated by the IOMAP chart would take the smart-contracts giant down to $330, where the daily 100-SMA resides.
Can TRON comeback after its recent correction?
Although TRX saw a massive 125% price surge towards $0.049, it is currently only trading at $0.026 after a steep correction. DappRadar reveals a massive spike in daily active wallets in the past two months.
TRX Daily Active Wallets
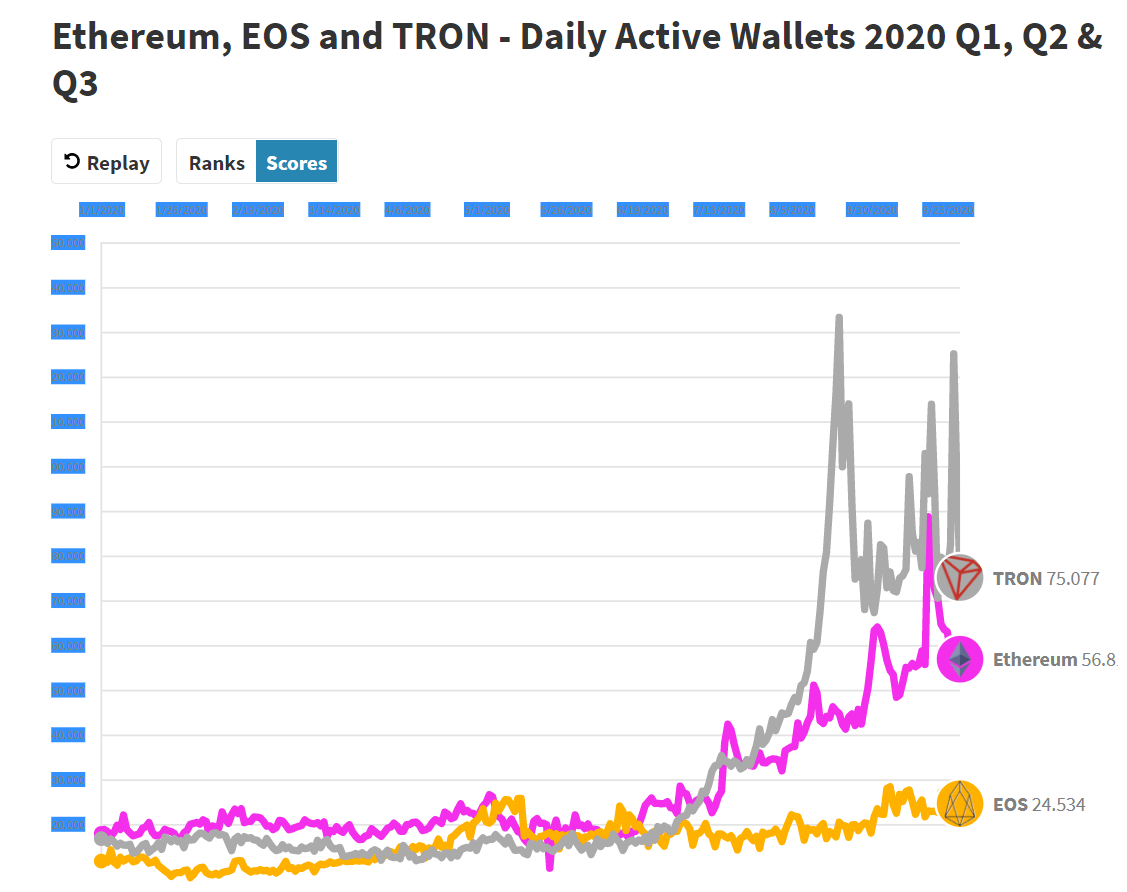
This increase is notable because it has even surpassed Ethereum. The report also mentions that the high-risk category on TRON is what added the most to this growth with a 55% contribution.
TRX/USD daily chart
-637370917651404997.png)
TRX is down 47% since its peak and has lost the 50-MA as a support level. The MACD has remained bearish for the most part and will continue this way if bears remain in control. A bearish breakout below the support level at $0.025 will take the digital asset down to the 100-MA at $0.023.
TRX/USD 4-hour chart
 (1)-637370917798281190.png)
TRX price is currently trading inside a downtrend after establishing lower highs and lower lows. The price also lost the 50-MA as a support level, and the MACD remains bearish.
On the other hand, investors need to keep an eye on the 50-MA in the short-term as the price could still climb above it and turn it back into a support level. A breakout above the 50-SMA can take XRP up to $0.027, where the 100-SMA is currently standing.
Furthermore, the MACD can turn bullish at any point if the buyers can push XRP even just slightly.
Author

Lorenzo Stroe
Independent Analyst
Lorenzo is an experienced Technical Analyst and Content Writer who has been working in the cryptocurrency industry since 2012. He also has a passion for trading.


