• Ethereum Classic jumped up to $62.67 on Wednesday before starting to fade.
  • The profit-taking is being seen in all major cryptocurrencies as well. 
  • On the downside, we have a few supports that will keep ETC around $46.

Ethereum Classic price dipped lower today and looks to fade after the uptrend that lasted five consecutive days, reaching a high of $62.67 on Wednesday.

Ethereum Classic price has a bandwidth of 25%

Ethereum Classic's steep climb in May was maybe just a bit too violent and deserved a correction after many indicators pointed to an overbought condition. The fade ETC saw in May and June made it test twice the support at $32.90. 

ETC recovered and was able to get out of a bearish pattern with a break to the upside of the descending trendline on June 29.

Ethereum Classic price has proven that it still has the potential to go higher. However, it recently saw a rejection of the $62 level, which might show that further upside is limited. A target of $68 would be excellent, but we see profit-taking today in all major cryptocurrencies. Hence, the upside looks limited for the rest of the week. 

The general sentiment should nonetheless help. It is a bit contradictory that we do not see this translated to ETC catching a bid and going for the $68 price target. With the 55-day Simple Moving Average (SMA) and a nearby 23.8% Fibonacci level, this looks like a solid resistance level. It should be tempting for buyers to run the price up toward that level. 

On the downside, the break of the descending trend line exposed a short-term floor around $46. Ethereum Classic price shot through this resistance and has not come back since. Sellers will look to target this level for profit-taking on their shorts.
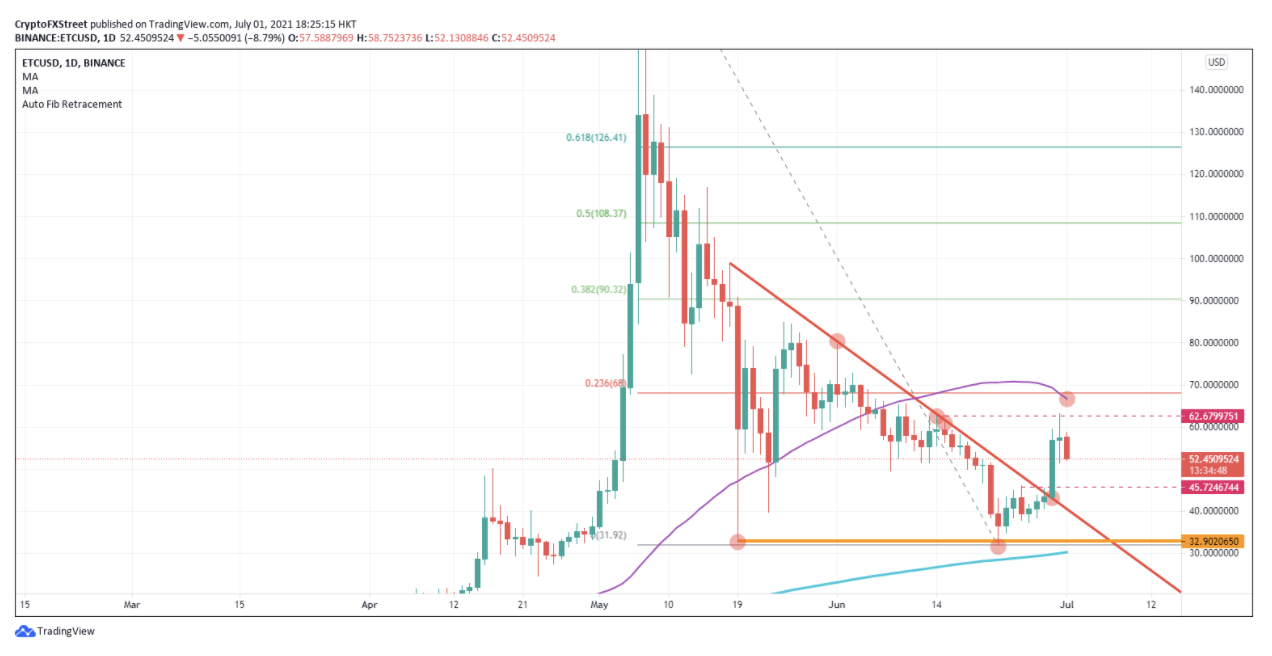
ETC/USD daily chart

ETC/USD daily chart

To summarize, we see in ETC both buyers and sellers awaiting a break, either way, to jump on the opportunity. This will keep Ethereum Classic price within the bandwidth between $62 to the upside and $46 to the downside. Should we break either boundary, look for $68 with the Fibonacci level and the 55-day SMA as guardians for the resistance. 

On the flip side, if the $62 level breaks, we can see a retest of the $32.90 level, with the 200-day SMA and the double bottom as support.


Information on these pages contains forward-looking statements that involve risks and uncertainties. Markets and instruments profiled on this page are for informational purposes only and should not in any way come across as a recommendation to buy or sell in these assets. You should do your own thorough research before making any investment decisions. FXStreet does not in any way guarantee that this information is free from mistakes, errors, or material misstatements. It also does not guarantee that this information is of a timely nature. Investing in Open Markets involves a great deal of risk, including the loss of all or a portion of your investment, as well as emotional distress. All risks, losses and costs associated with investing, including total loss of principal, are your responsibility. The views and opinions expressed in this article are those of the authors and do not necessarily reflect the official policy or position of FXStreet nor its advertisers. The author will not be held responsible for information that is found at the end of links posted on this page.

If not otherwise explicitly mentioned in the body of the article, at the time of writing, the author has no position in any stock mentioned in this article and no business relationship with any company mentioned. The author has not received compensation for writing this article, other than from FXStreet.

FXStreet and the author do not provide personalized recommendations. The author makes no representations as to the accuracy, completeness, or suitability of this information. FXStreet and the author will not be liable for any errors, omissions or any losses, injuries or damages arising from this information and its display or use. Errors and omissions excepted.

The author and FXStreet are not registered investment advisors and nothing in this article is intended to be investment advice.

Join Telegram

Recommended content


Recommended Content

Editors’ Picks

Celebrity meme coins controversy continues amid Pump.fun revenue dominance

Celebrity meme coins controversy continues amid Pump.fun revenue dominance

Pump.fun outperformed the Ethereum blockchain on Tuesday after raking in $1.99 million. Following this achievement, a meme coin based on actress Sydney Sweeney was the subject of controversy after its developers dumped their bags on investors.

More Meme Coins News

PEPE's on-chain metrics indicate potential rally after weeks of silence

PEPE's on-chain metrics indicate potential rally after weeks of silence

PEPE has struggled to see any significant price move after reaching an all-time high in May. Increased adoption rate and low MVRV ratio indicate a bullish run may be on the horizon. A single PEPE outflow from Binance worth $14.7 million gives credence to signs of bullish expectation.

More Pepe News

Ethereum has failed to overcome key resistance despite bullish sentiment surrounding ETH ETF

Ethereum has failed to overcome key resistance despite bullish sentiment surrounding ETH ETF

Ethereum (ETH) is down more than 1.4% on Tuesday following another ETH sale from the Ethereum Foundation. Meanwhile, crypto exchange Gemini's recent report reveals that ETH ETF could see about $5 billion in net inflows within six months of launch.

More Ethereum News

Crypto community blasts Polkadot following report of treasury spending

Crypto community blasts Polkadot following report of treasury spending

Polkadot reports $87 million of treasury spending during H1. Crypto community members expressed harsh feelings toward the DOT team's high spending. DOT is up more than 2% in the past 24 hours but risks correction following the report.

More Polkadot News

Bitcoin: BTC price correction could end in July, according to seasonal data

Bitcoin: BTC price correction could end in July, according to seasonal data

Bitcoin (BTC) price appears poised for a decline this week, influenced by slight outflows in US spot ETFs, selling activity among BTC miners, and a combined transfer of 4,690.28 BTC to centralized exchanges by the US and German governments.

Read full analysis

BTC

ETH

XRP