Ethereum Classic Price Prediction: ETC eyes 17% decline as crypto market weakens
- Ethereum Classic price is consolidating in a tight range, anticipating a massive breakout.
- A breach below the 50% Fibonacci retracement level at $61.68 will signal the start of a downtrend.
- If ETC produces a decisive 4-hour candlestick close above $72.17, a bullish outlook might evolve.

Ethereum Classic price began consolidating on May 28 and has slid into a tight range ever since. Investors can expect an explosive move soon where ETC bursts below a critical support level.
Ethereum Classic price eyes a lower low
Ethereum Classic price rallied 109% between May 23 and May 26, creating a trading range that is still in play. Since this boundary was formed, ETC has not concretely broken below the 50% Fibonacci retracement level at $61.68.
From May 28, Ethereum Classic price has been on a steady decline that is trading in a tight range, extremely close to $61.68. Therefore, investors can expect an outburst of volatility in the next move.
The presence of the 50 four-hour and the 100 four-hour Simple Moving Averages (SMA) at $66.54 reveals that ETC might head lower. A rejection at this level might push Ethereum Classic price down 17% to tag the demand zone extending from $48.78 to $54.12.
Market participants can expect ETC to find support around the 70.5% Fibonacci retracement level at $52.71.
A breakdown of $48.78 might result in a sharp decline to the support level at $45 or the range low at $39.79.
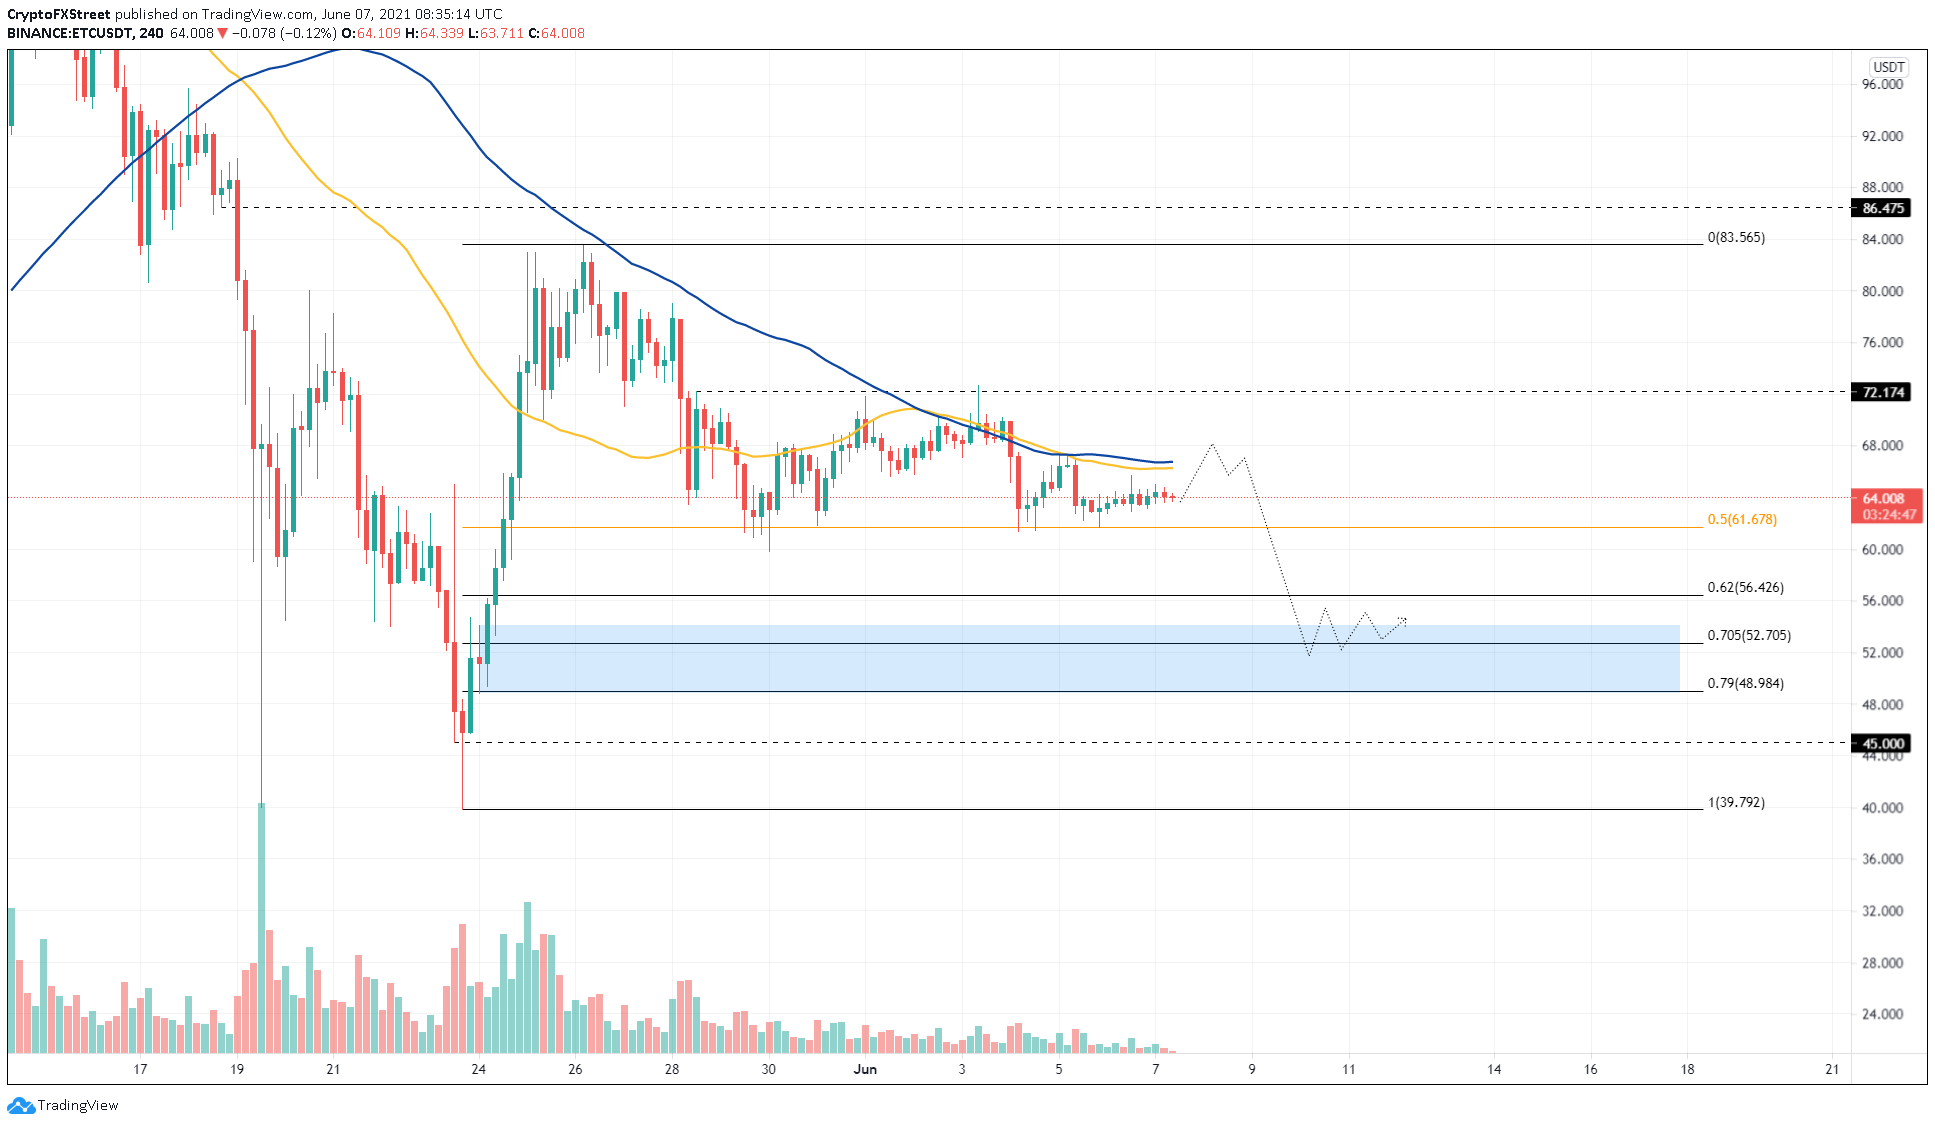
ETC/USDT 4-hour chart
On the other hand, if Ethereum Classic price manages to set up a higher high above $72.17, it would invalidate the bearish outlook and signal the resurgence of buyers.
If this were to happen, investors could expect ETC to rally 15% to the range high at $83.57 or sweep this swing high to tag the resistance level at $86.48.
Author

Akash Girimath
FXStreet
Akash Girimath is a Mechanical Engineer interested in the chaos of the financial markets. Trying to make sense of this convoluted yet fascinating space, he switched his engineering job to become a crypto reporter and analyst.


