- Ethereum Classic price faces multiple resistance levels, keeping it from climbing higher.
- The MRI has printed a preemptive top signal, suggesting a reversal might arrive shortly.
- A breakdown of the demand zone’s lower boundary at $48.82 will kick-start an ETC bearish run.
Etheruem Classic price seems to be losing steam as multiple resistance barriers stand against it. To make matters worse for the bulls, ETC could continue its descent since a key technical indicator has flashed a warning sign.
Ethereum Classic price at an inflection point
Ethereum Classic price has seen a steady 20% climb after a bounce from the 50% Fibonacci retracement level at $60.13 on May 30. This rally suddenly faced a headwind from the 50 four-hour Simple Moving Average (SMA) at $70.48, failing to cross above it.
Moreover, the 100 four-hour SMA has slipped below the 200 four-hour SMA, forming a bearish crossover. Such a move indicates that the short-term selling momentum is increasing faster, which is a bearish sign.
Dealing the final blow to the bull run is the Momentum Reversal Indicator (MRI), which has flashed a preemptive top in the form of a yellow down arrow on the 4-hour chart. This means that if Ethereum Classic price continues to rally, a sell signal in the form of a red ‘one’ candlestick will be set up.
This technical formation forecasts a one-to-four candlestick correction. Therefore, investors need to be wary of Ethereum Classic price, which is at an inflection point.
The sellers will likely push ETC down by 11% to tag the 50% Fibonacci retracement level at $60.128.
If the buyers rescue the altcoin there, an uptrend will evolve, but the drop is likely to continue until Ethereum Classic price dips into the demand zone ranging from $48.88 to $54.31.
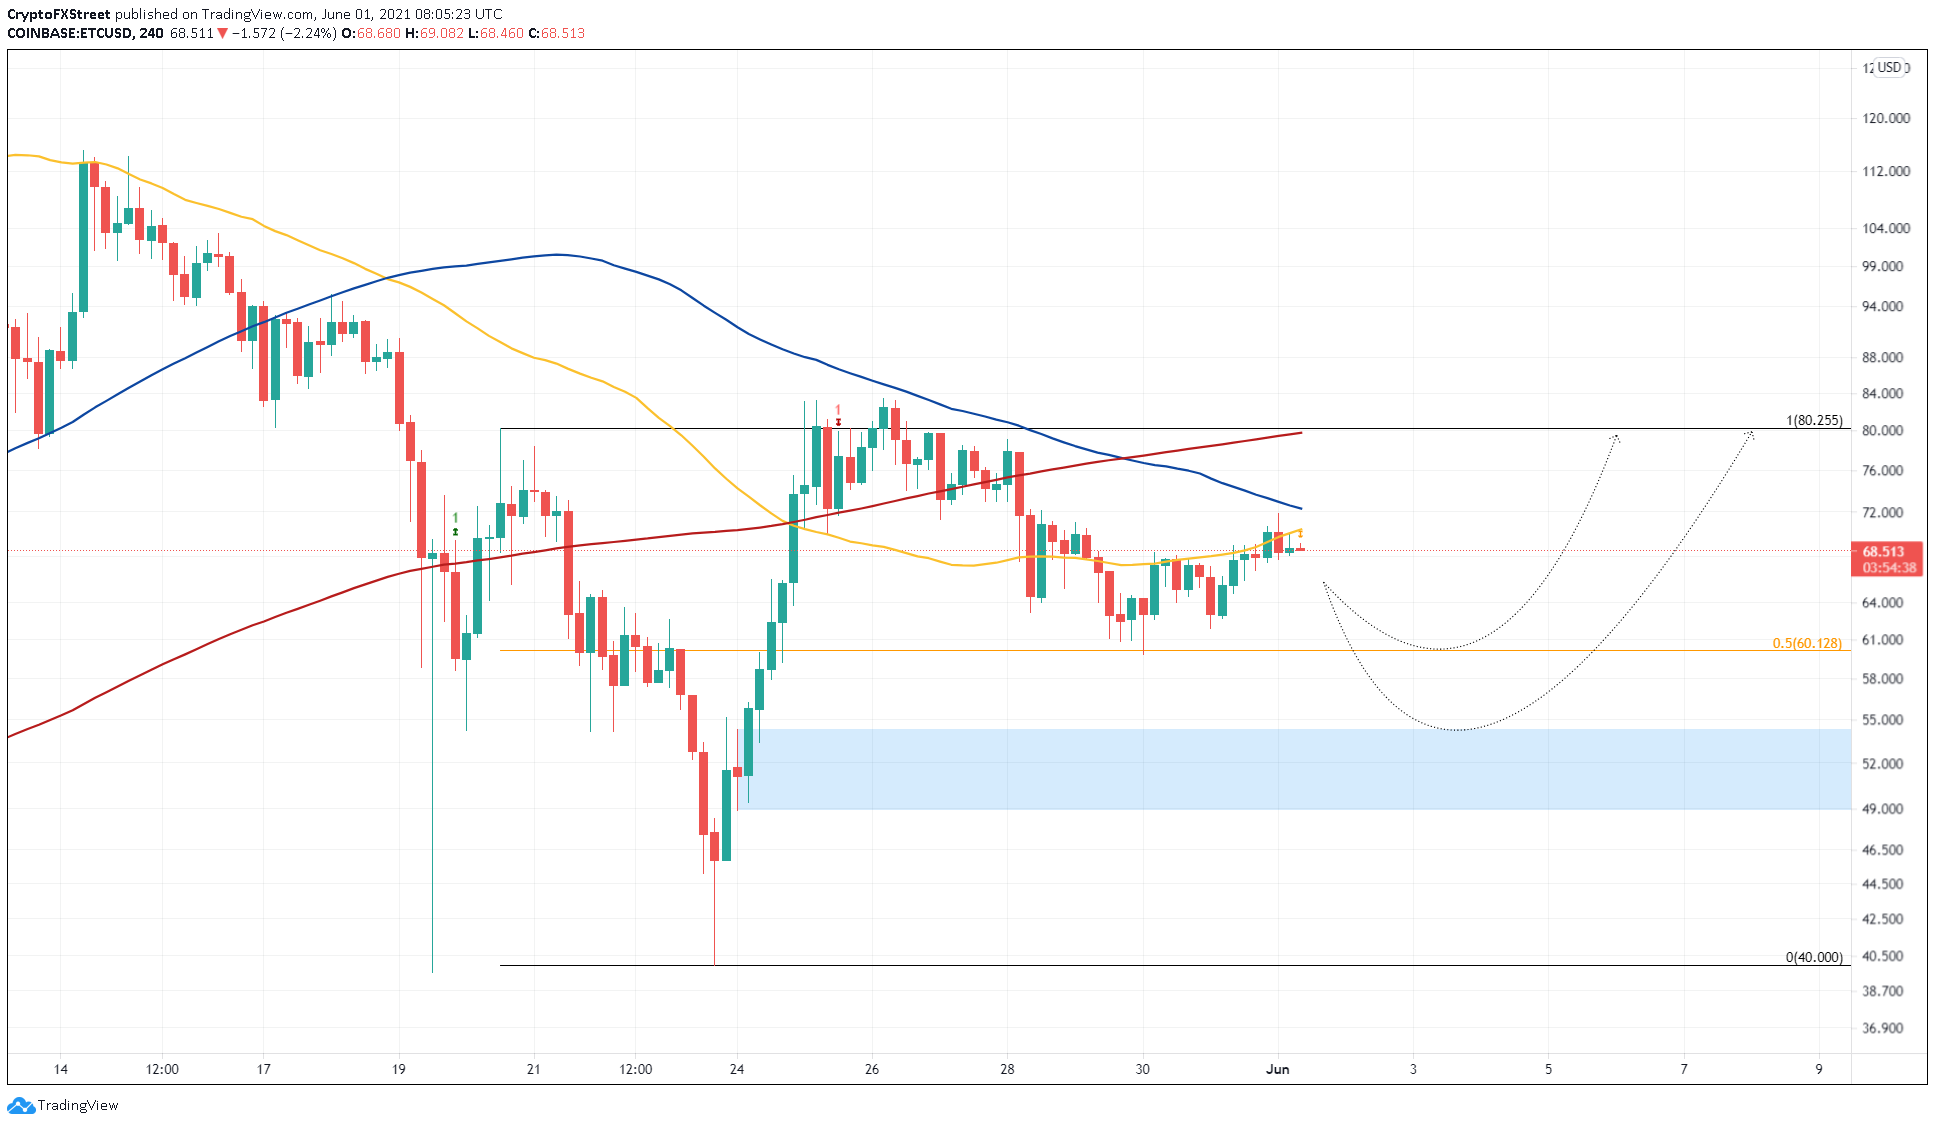
ETC/USD 4-hour chart
There is a high possibility that the buying pressure will replenish in this demand zone, allowing the bulls to gather some steam back. A bullish impulse would push ETC by 47% to the swing high at $80.26, coinciding with the 200 four-hour SMA.
Regardless of any buying pressure, if the bears push Ethereum Classic price to produce a solid 4-hour candlestick close below $48.82, this would invalidate any bullish narrative.
Under these dire circumstances, ETC could slide 6% to the immediate support at $45.81.
Information on these pages contains forward-looking statements that involve risks and uncertainties. Markets and instruments profiled on this page are for informational purposes only and should not in any way come across as a recommendation to buy or sell in these assets. You should do your own thorough research before making any investment decisions. FXStreet does not in any way guarantee that this information is free from mistakes, errors, or material misstatements. It also does not guarantee that this information is of a timely nature. Investing in Open Markets involves a great deal of risk, including the loss of all or a portion of your investment, as well as emotional distress. All risks, losses and costs associated with investing, including total loss of principal, are your responsibility. The views and opinions expressed in this article are those of the authors and do not necessarily reflect the official policy or position of FXStreet nor its advertisers. The author will not be held responsible for information that is found at the end of links posted on this page.
If not otherwise explicitly mentioned in the body of the article, at the time of writing, the author has no position in any stock mentioned in this article and no business relationship with any company mentioned. The author has not received compensation for writing this article, other than from FXStreet.
FXStreet and the author do not provide personalized recommendations. The author makes no representations as to the accuracy, completeness, or suitability of this information. FXStreet and the author will not be liable for any errors, omissions or any losses, injuries or damages arising from this information and its display or use. Errors and omissions excepted.
The author and FXStreet are not registered investment advisors and nothing in this article is intended to be investment advice.
Recommended Content
Editors’ Picks
Ripple on-chain metrics show bullish signs amidst legal struggle with SEC, XRP eyes recovery
Ripple made a comeback above $0.48 on Tuesday and hovers above that level in Wednesday’s European session. Ripple on-chain metrics such as transaction volume and Network Realized Profit/Loss have turned bullish, supporting a recovery in the altcoin.
Bitcoin price falls amidst German government transfers, miners activity
Bitcoin (BTC) extends correction on Wednesday and hovers around $61,000 after finding resistance near the $64,000 level on Monday. Recent on-chain data indicates heightened selling activity from Bitcoin miners early in the week.
Crypto Today: Bitcoin erases gains from end of June, Ethereum declines while Ripple holds
Bitcoin wipes out gains from the last week of June and falls below $60,000 on Wednesday. Ethereum and top altcoins ranked by market capitalization erased gains as the inflation outlook worsened. Ripple holds on to recent gains and hovers above $0.48 on Wednesday.
Three reasons why altcoins could shake off losses this week
On-chain data from Santiment shows that altcoins are currently in the opportunity zone, or generating buy signals. The top three altcoins in the buy zone are Basic Attention Token (BAT), Chromia (CHR), and Highstreet (HIGH), per Santiment.
Bitcoin: BTC price correction could end in July, according to seasonal data
Bitcoin (BTC) price appears poised for a decline this week, influenced by slight outflows in US spot ETFs, selling activity among BTC miners, and a combined transfer of 4,690.28 BTC to centralized exchanges by the US and German governments.