- Ethereum Classic price action points to a very bullish breakout according to a technical indicator.
- ETC price action faces many hurdles and caps that could quickly slow down the rally.
- A big bullish catalyst is needed, and several elements will need to work together to bring ETC price back to $32.90.
Ethereum Classic price action is set to rally if the current signals are reliable. Bullish signs point to a break above the red descending trendline, which has been pushing price action to the downside since September. Although this signals that every bull will want to get in on the trade, tight trade management is needed as several hurdles could easily trigger a rejection and push price action back to the downside.
ETC price demands a tight and thorough trade management
Ethereum Classic price action is showing signs that it could jump some more percentages to the upside. First is the break above the red descending trend line, which is just plain and simple, a bullish signal. Secondly, the rally in equity markets is helping lift sentiment and should see more upside potential to come.
ETC price action, however, has a few hurdles to face, so tight and realistic trade management is needed when trading this rally. The first hurdle is the 200-day Simple Moving Average (SMA) at $27.18, which is already acting as a cap in July and throughout September. Secondly, the 55-day SMA at $29 looks set to trigger another profit-taking event after the 200-day SMA which is likely to have already slowed down the rally, and the 55-day will probably be the end of the line with $32.90 out of reach.
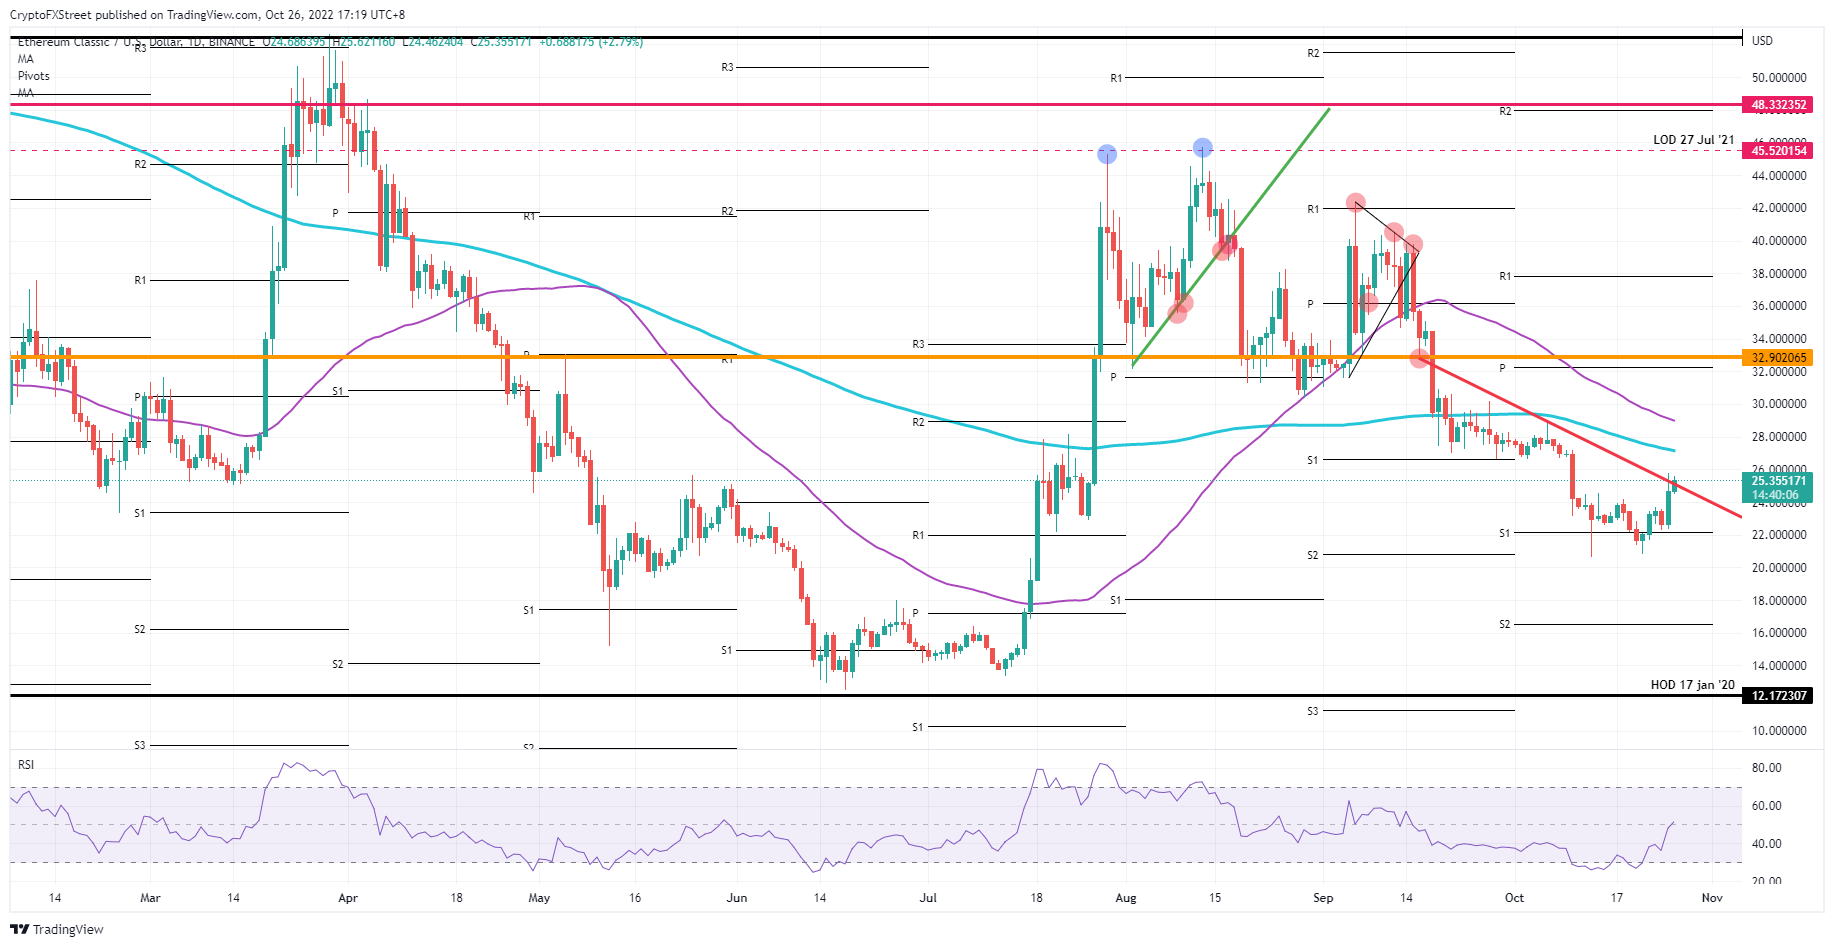
ETC/USD Daily chart
The risk to the downside could come from earnings out later this week if they start to deteriorate a little bit further. With still some big tech names on the docket, such as Apple, sentiment could easily switch and turn into a cramp. That would mean that the break above the red descending trend line will turn out to be a false bull trap, leading to a pullback towards $22. From there, more downside is set, with $20 due for a third test.
Information on these pages contains forward-looking statements that involve risks and uncertainties. Markets and instruments profiled on this page are for informational purposes only and should not in any way come across as a recommendation to buy or sell in these assets. You should do your own thorough research before making any investment decisions. FXStreet does not in any way guarantee that this information is free from mistakes, errors, or material misstatements. It also does not guarantee that this information is of a timely nature. Investing in Open Markets involves a great deal of risk, including the loss of all or a portion of your investment, as well as emotional distress. All risks, losses and costs associated with investing, including total loss of principal, are your responsibility. The views and opinions expressed in this article are those of the authors and do not necessarily reflect the official policy or position of FXStreet nor its advertisers. The author will not be held responsible for information that is found at the end of links posted on this page.
If not otherwise explicitly mentioned in the body of the article, at the time of writing, the author has no position in any stock mentioned in this article and no business relationship with any company mentioned. The author has not received compensation for writing this article, other than from FXStreet.
FXStreet and the author do not provide personalized recommendations. The author makes no representations as to the accuracy, completeness, or suitability of this information. FXStreet and the author will not be liable for any errors, omissions or any losses, injuries or damages arising from this information and its display or use. Errors and omissions excepted.
The author and FXStreet are not registered investment advisors and nothing in this article is intended to be investment advice.
Recommended Content
Editors’ Picks

Bitcoin Weekly Forecast: New all-time high at $78,900 looks feasible
Bitcoin price declines over 2% this week, but the bounce from a key technical level on the weekly chart signals chances of hitting a new all-time high in the short term. US spot Bitcoin ETFs posted $596 million in inflows until Thursday despite the increased profit-taking activity.

XRP fails to recover even as Ripple files appeal in response to SEC's move
Ripple price has been range bound between $0.5666 and $0.5068 since October 3. Over the past 20 days, XRP has traded within the range even as the SEC vs. Ripple lawsuit sees new developments.

Ethereum Price Forecast: ETH declines below $2,500 as demand fades
Ethereum price is nearing its daily support level of $2,461; a firm close below this level would suggest a decline ahead. Coinbase Premium Index shows signs of weakness and remains below neutral levels.

Top 3 Price Prediction Bitcoin, Ethereum, Ripple: BTC shows signs of recovery
Bitcoin has found support at the key $66,000 level, suggesting a potential recovery. However, Ethereum and Ripple prices are struggling below their critical support levels, indicating a possible continuation of their downtrends.
Bitcoin: New all-time high at $78,900 looks feasible
Bitcoin (BTC) trades slightly down at around $67,500 on Friday after finding support around the $66,000 level on Wednesday, following three consecutive days of decline earlier in the week.

Best Forex Brokers with Low Spreads
VERIFIED Low spreads are crucial for reducing trading costs. Explore top Forex brokers offering competitive spreads and high leverage. Compare options for EUR/USD, GBP/USD, USD/JPY, and Gold.