ETH/USD technical analysis: Ethereum is in an accending channel

The price of Ethereum was at $96.65 on Monday. During the week, the price has declined and fell to around $88 area.
After the drop ETH/USD increased again but has currently been stopped out at the minor resistance level. The cryptocurrency pair is currently trading at $92.74 on FXOpen which is a 4.21% decrease overall.
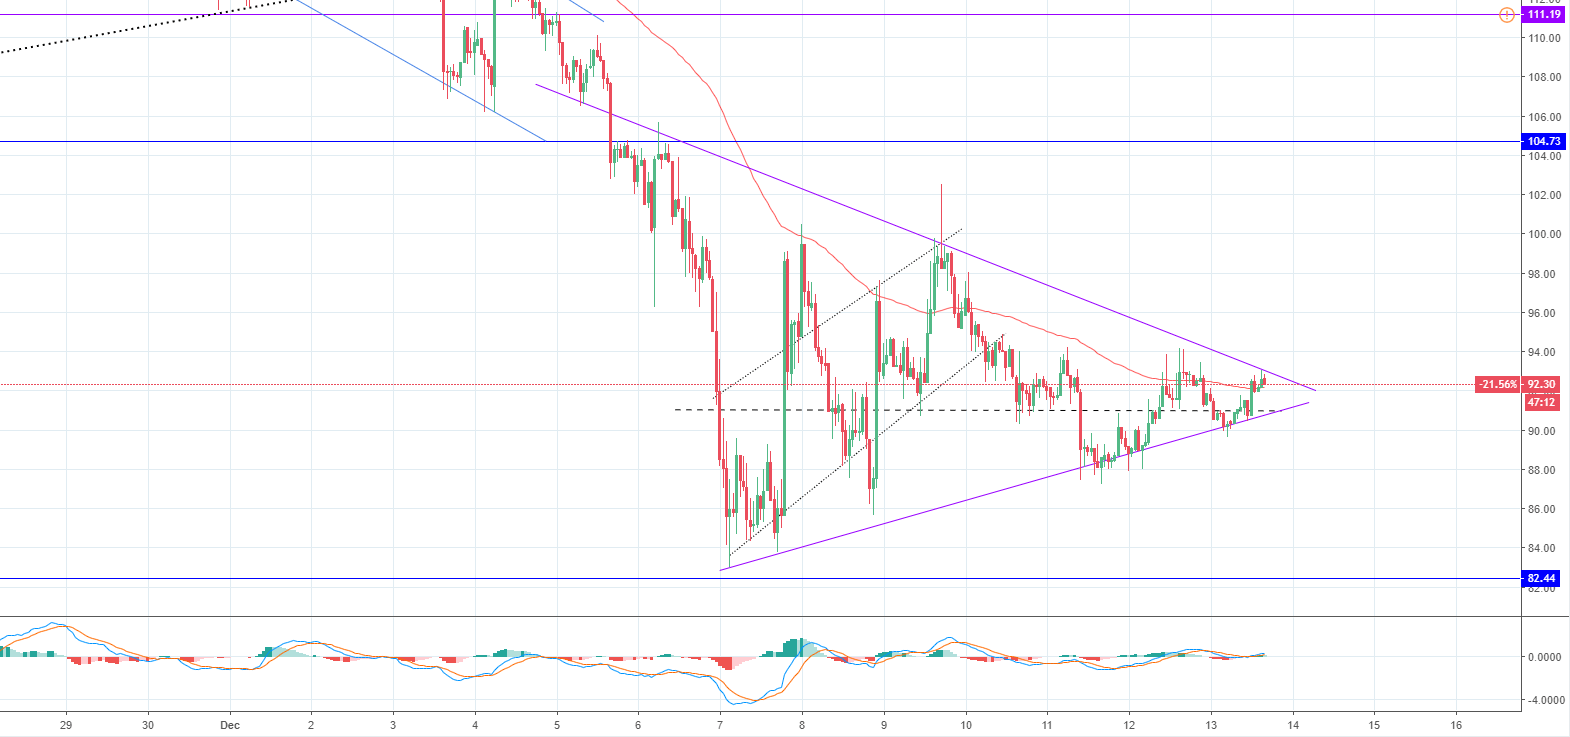
On the hourly chart, the price action formed an ascending channel. Then a breakout occurred from the downside and another ascending structure appeared. All of these bounces are the part of a symmetrical triangle.
As the altcoin price is getting close to its apex, we are going to see a breakout soon and as this is a symmetrical triangle a breakout from both sides is equally probable.
The breakout from the upside is expected, as most likely that this triangle is a correction to the upside after a down move, which will continue thereafter.
If the Ethereum goes down, a retest of the prior low level at $82 would be a most likely scenario.
Author

FXOpen Broker Team
FXOpen


