ETH/USD technical analysis: Ethereum in a bearish zone against the US dollar

From last week, when the price of Ethereum was at $117 on Monday, we have seen sideways movement, where the price went on to increase to $132.4 at first. It was the W wave from the Minute WXY, after which a decline to $120 has been made on the 0.5 Fibonacci level, followed by another increase to the upside when the price reached $128.2 on the Y wave.
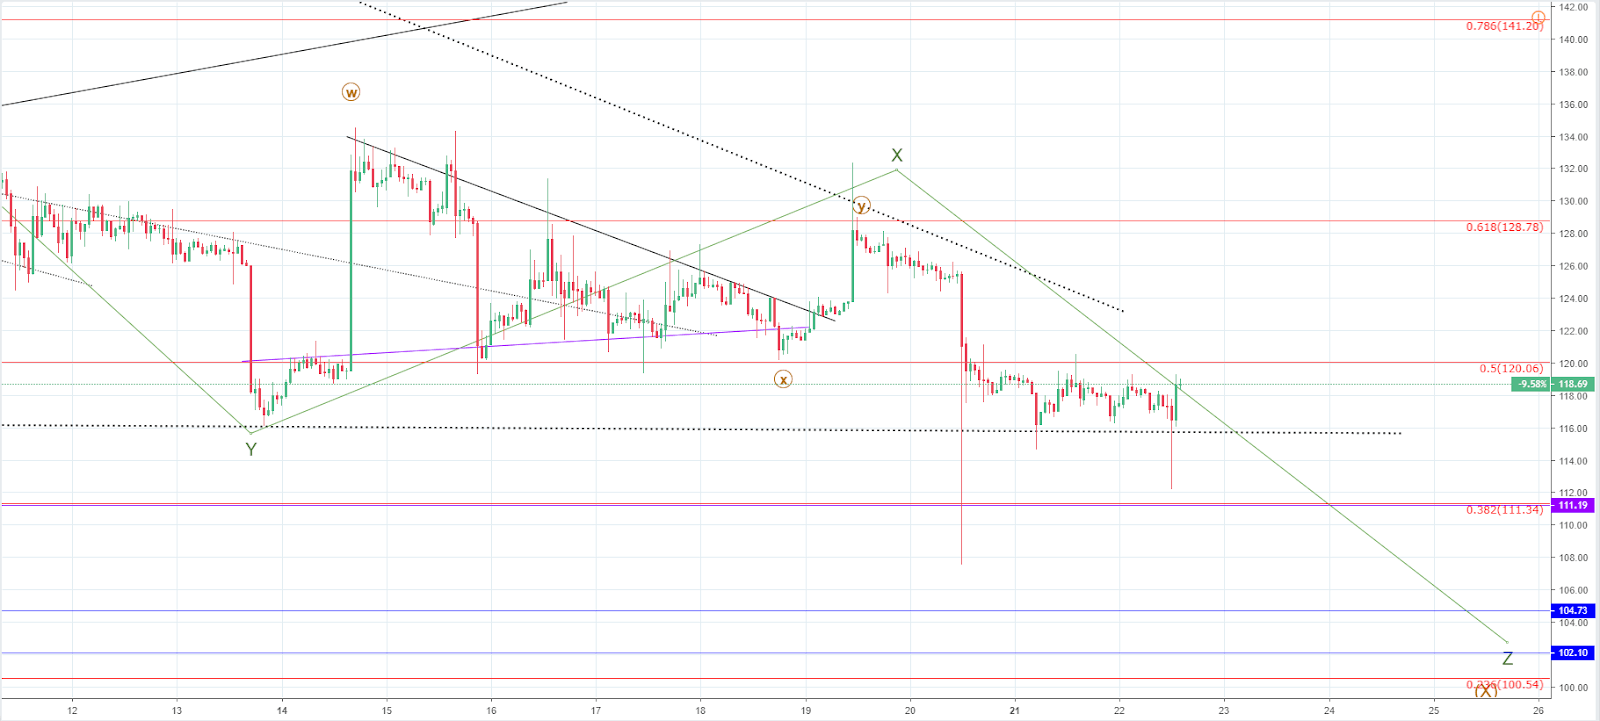
This sideways move was the second wave X from a Minor WXYXZ correction. The price has been there since 24th of December. That is why after it ended further downside movement started.
Currently, the price is stuck in a range around $116 on FXOpen, the last Monday’s price and the 0.5 Fibonacci level, which was previously broken. As the price has been hovering around $117, the candle on the weekly chart is a Doji indicating that the buyers and the sellers were equally aggressive in the last week.
From there further downside is expected as the final Z wave should fully develop. However, that might not happen in a straight line as the price might go higher up to retest the 0.5 Fibonacci level properly.
The price target for the ending point of the Z wave would be at least to the 0.382 Fibonacci level or at $111 in price terms. But it could go further down, depending on the momentum behind the sell-off in which case the next significant horizontal level would be around $104.
Author

FXOpen Broker Team
FXOpen


