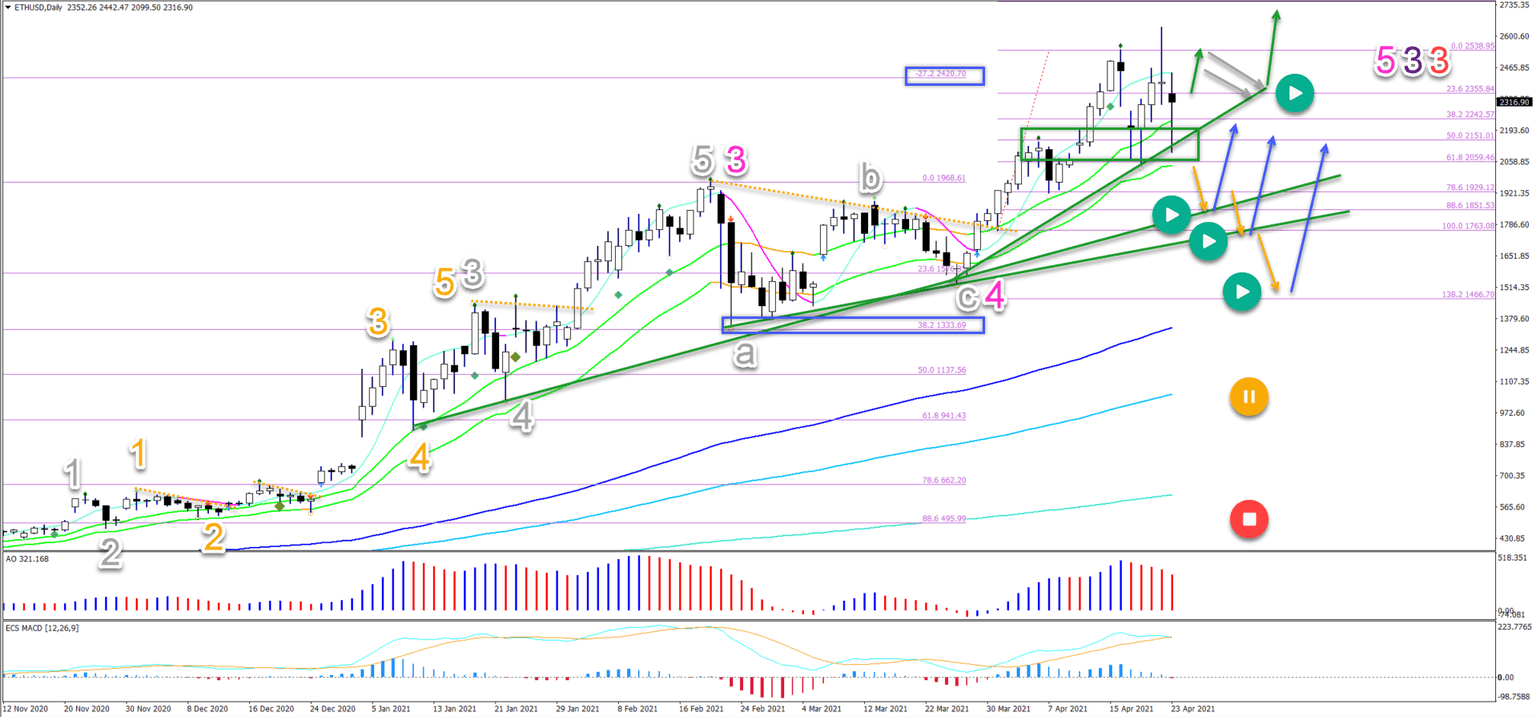
Ethereum (ETH/USD) is showing significant wicks on both sides of the daily candlesticks. The struggle between bulls and bears is, however, above the 21 ema zone in a strong uptrend (all moving averages are aligned).

Price Charts and Technical Analysis

The ETH/USD remains in a well established uptrend. Price action recently completed an ABC (grey) pattern in wave 4 (pink). After that, price action broke above the 21 ema zone for another bullish swing up:

  1. So far, the bullish swing is not yet completed because the AO bars on the daily chart are still far above the middle line of the oscillator. Price action has bounced from the 38.2% Fib to the -27.2% Fibonacci target.
  2. This means that price action seems to be in an ongoing wave 5 (pink) for the moment.
  3. Also, when reviewing price action, bulls seem determined to defend the support zone (green box), the trend lines (green), and 21 ema zone.
  4. A break below the 21 ema zone indicates the end of the wave 5 (pink) but not the end of the uptrend. Simply because price action is expected to bounce at the lower support levels.
  5. Only a very deep retracement places the uptrend on hold (orange circle) or invalidates it (red circle).
  6. An immediate breakout higher (green arrows) could indicate a push towards the -61.8% Fibonacci target around $3,000. A bull flag pattern (grey arrows) could confirm a shallow pullback to the previous top.

On the 4 hour chart, the roller coaster push up and down seem to be part of an ABC (orange) pattern in wave 4 (grey). Price action is now testing the 21 emas, which is a key decision zone for a breakout or bounce:

  1. A bullish breakout above the 21 ema zone should confirm an uptrend continuation (green arrow). 
  2. The previous tops can create a bull flag (grey arrows) pattern. A break of that pattern indicates a full uptrend (green arrow).
  3. A minor pullback (orange arrow) to the support trend (green) could see a bounce (green arrow).
  4. A bearish breakout (dotted orange arrow) could indicate a deeper wave correction but the uptrend remains valid.


Elite CurrenSea Training Program(s) should not be treated as a recommendation or a suggestion to buy or sell any security or the suitability of any investment strategy for Student. The purchase, sale, or advice regarding any security, other financial instrument or system can only be performed by a licensed Industry representative; such as, but not limited to a Broker/Dealer, Introducing Broker, FCM and/or Registered Investment Advisor. Neither Elite CurrenSea nor its representatives are licensed to make such advisements. Electronic active trading (trading) may put your capital at risk, hence all trading decisions are made at your own risk. Furthermore, trading may also involve a high volume & frequency of trading activity. Each trade generates a commission and the total daily commission on such a high volume of trading can be considerable. Trading accounts should be considered speculative in nature with the objective being to generate short-term profits. This activity may result in the loss of more than 100% of an investment, which is the sole responsibility of the client. Any trader should realise the operation of a margin account under various market conditions and review his or her investment objectives, financial resources and risk tolerances to determine whether margin trading is appropriate for them. The increased leverage which margin provides may heighten risk substantially, including the risk of loss in excess of 100% of an investment.

Recommended content


Recommended Content

Editors’ Picks

Bitcoin Weekly Forecast: BTC nosedives below $95,000 as spot ETFs record highest daily outflow since launch

Bitcoin Weekly Forecast: BTC nosedives below $95,000 as spot ETFs record highest daily outflow since launch

Bitcoin price continues to edge down, trading below $95,000 on Friday after declining more than 9% this week. Bitcoin US spot ETFs recorded the highest single-day outflow on Thursday since their launch in January.

More Bitcoin News
Bitcoin crashes to $96,000, altcoins bleed: Top trades for sidelined buyers

Bitcoin crashes to $96,000, altcoins bleed: Top trades for sidelined buyers

Bitcoin (BTC) slipped under the $100,000 milestone and touched the $96,000 level briefly on Friday, a sharp decline that has also hit hard prices of other altcoins and particularly meme coins. 

More Bitcoin News
Solana Price Forecast: SOL’s technical outlook and on-chain metrics hint at a double-digit correction

Solana Price Forecast: SOL’s technical outlook and on-chain metrics hint at a double-digit correction

Solana (SOL) price trades in red below $194 on Friday after declining more than 13% this week. The recent downturn has led to $38 million in total liquidations, with over $33 million coming from long positions.

More Solana News
SEC approves Hashdex and Franklin Templeton's combined Bitcoin and Ethereum crypto index ETFs

SEC approves Hashdex and Franklin Templeton's combined Bitcoin and Ethereum crypto index ETFs

The SEC approved Hashdex's proposal for a crypto index ETF. The ETF currently features Bitcoin and Ethereum, with possible additions in the future. The agency also approved Franklin Templeton's amendment to its Cboe BZX for a crypto index ETF.

More Cryptocurrencies News
Bitcoin: 2025 outlook brightens on expectations of US pro-crypto policy

Bitcoin: 2025 outlook brightens on expectations of US pro-crypto policy

Bitcoin (BTC) price has surged more than 140% in 2024, reaching the $100K milestone in early December. The rally was driven by the launch of Bitcoin Spot Exchange Traded Funds (ETFs) in January and the reduced supply following the fourth halving event in April.

Read full analysis
Best Forex Brokers with Low Spreads

Best Forex Brokers with Low Spreads

VERIFIED Low spreads are crucial for reducing trading costs. Explore top Forex brokers offering competitive spreads and high leverage. Compare options for EUR/USD, GBP/USD, USD/JPY, and Gold.

Read More

BTC

ETH

XRP