|

EOS technical analysis: EOS/USD bulls try to step up to prevent further downward movement

  • EOS/USD is priced at $3.21 in the early hours of Friday.
  • The relative strength index (RSI) curve has crept into the oversold zone.

EOS/USD daily chart

fxsoriginal

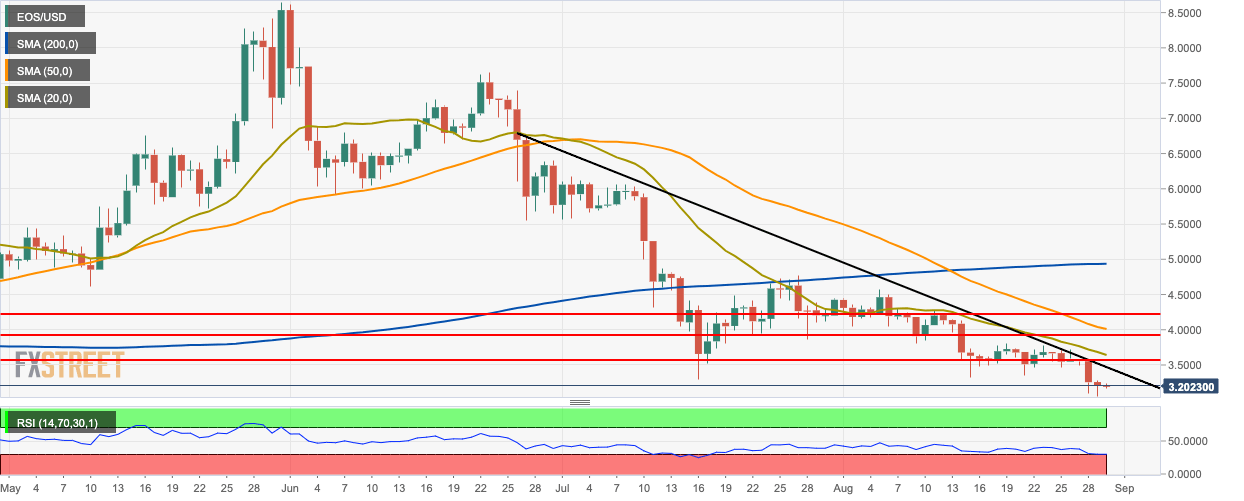
EOS/USD is on the course of having a bullish day after three straight bearish days. Over Tuesday, Wednesday, and Thursday, the price of EOS/USD had fallen from $3.58 to $3.20. So far, the bulls were able to take the price up to $3.21 slightly. The price has found resistance on the downward trending line and is trending below the 200-day simple moving average (SMA 200), SMA 50 and SMA 20 curves. The relative strength index (RSI) curve has crept into the oversold zone.

EOS/USD 4-hour chart

fxsoriginal

The 4-hour EOS/USD price chart shows that a sudden bearish move which took the price below the 20-day Bollinger band, indicating that it was underpriced. Since then, the price trended horizontally and re-entered the Bollinger band. The moving average convergence/divergence (MACD) indicator shows decreasing bearish momentum.

EOS/USD hourly chart

fxsoriginal

The hourly EOS/USD  chart was trending horizontally when it suddenly plunged from $3.20 to $3.08. Immediately after that, the EOS/USD price went up from $3.08 to $3.19, indicating that the bulls rallied together and fought back. Elliott oscillator shows sustained bullish momentum.

Key Levels

EOS/USD

Overview
Today last price3.219
Today Daily Change0.01520
Today Daily Change %0.47
Today daily open3.2038
 
Trends
Daily SMA203.6845
Daily SMA504.0394
Daily SMA1005.3348
Daily SMA2004.92963
Levels
Previous Daily High3.2753
Previous Daily Low3.06
Previous Weekly High3.8013
Previous Weekly Low3.3574
Previous Monthly High6.1773
Previous Monthly Low3.3
Daily Fibonacci 38.2%3.14224
Daily Fibonacci 61.8%3.19306
Daily Pivot Point S13.0841
Daily Pivot Point S22.9644
Daily Pivot Point S32.8688
Daily Pivot Point R13.2994
Daily Pivot Point R23.395
Daily Pivot Point R33.5147


Author

Rajarshi Mitra

Rajarshi Mitra

Independent Analyst

Rajarshi entered the blockchain space in 2016. He is a blockchain researcher who has worked for Blockgeeks and has done research work for several ICOs. He gets regularly invited to give talks on the blockchain technology and cryptocurrencies.

More from Rajarshi Mitra
Share:

Editor's Picks

Ripple slides to $1.45 as downside risks surge

Ripple edges lower at the time of writing on Tuesday, from the daily open of $1.48, as headwinds persist across the crypto market. A short-term support is emerging at $1.45, but a buildup of bearish positions could further weaken the derivatives market and prolong the correction.

Bitcoin slips below $68,000 as defensive stance limits recovery

Bitcoin edges lower on Tuesday, extending consolidation in a trading range for over ten days. Market conditions remain defensive, with sustainable recovery depending on renewed spot demand, report says.

Crypto Today: Bitcoin, Ethereum, XRP upside looks limited amid deteriorating retail demand

The cryptocurrency market extends weakness with major coins including Bitcoin (BTC), Ethereum (ETH) and Ripple (XRP) trading in sideways price action at the time of writing on Tuesday.

Meme Coins Price Prediction: Bears push Dogecoin, Shiba Inu, Pepe to the ropes

Meme coins, including Dogecoin, Shiba Inu, and Pepe, are under pressure on Tuesday, extending Sunday’s decline. The derivatives data show substantial outflows from DOGE, SHIB, and PEPE futures Open Interest, primarily driven by long-side-skewed liquidations. 

Bitcoin Price Annual Forecast: BTC holds long-term bullish structure heading into 2026

Bitcoin (BTC) is wrapping up 2025 as one of its most eventful years, defined by unprecedented institutional participation, major regulatory developments, and extreme price volatility.

Bitcoin: BTC bears aren’t done yet

Bitcoin (BTC) price slips below $67,000 at the time of writing on Friday, remaining under pressure and extending losses of nearly 5% so far this week.