BTC price is attempting to stage a recovery, while EOS, STX, IMX and MKR are beginning to flash bullish signals.
The United States equities markets made a strong recovery this week but Bitcoin failed to follow suit. This means that cryptocurrency investors stayed away and could be worried by the ongoing problems at Silvergate bank. These fears could be what is behind the total crypto market capitalization dropping to nearly $1 trillion.
The behavior analytics platform Santiment said in a report on March 5 that there was a “huge spike of bearish sentiment” according to their bullish versus bearish word comparison Social Trends chart. However, the firm added that th “kind of overwhelmingly bearish sentiment can lead to a nice bounce to silence the critics.”
Another short-term positive for the crypto markets is the weakness in the U.S. dollar index (DXY), which fell by 0.70 in the past 7 days. This suggests that crypto markets may attempt a recovery over the next few days. As long as Bitcoin remains above $20,000, select altcoins may outperform the broader markets.
Let’s study the charts of Bitcoin and the four altcoins that are showing promise in the near term.
BTC/USDT
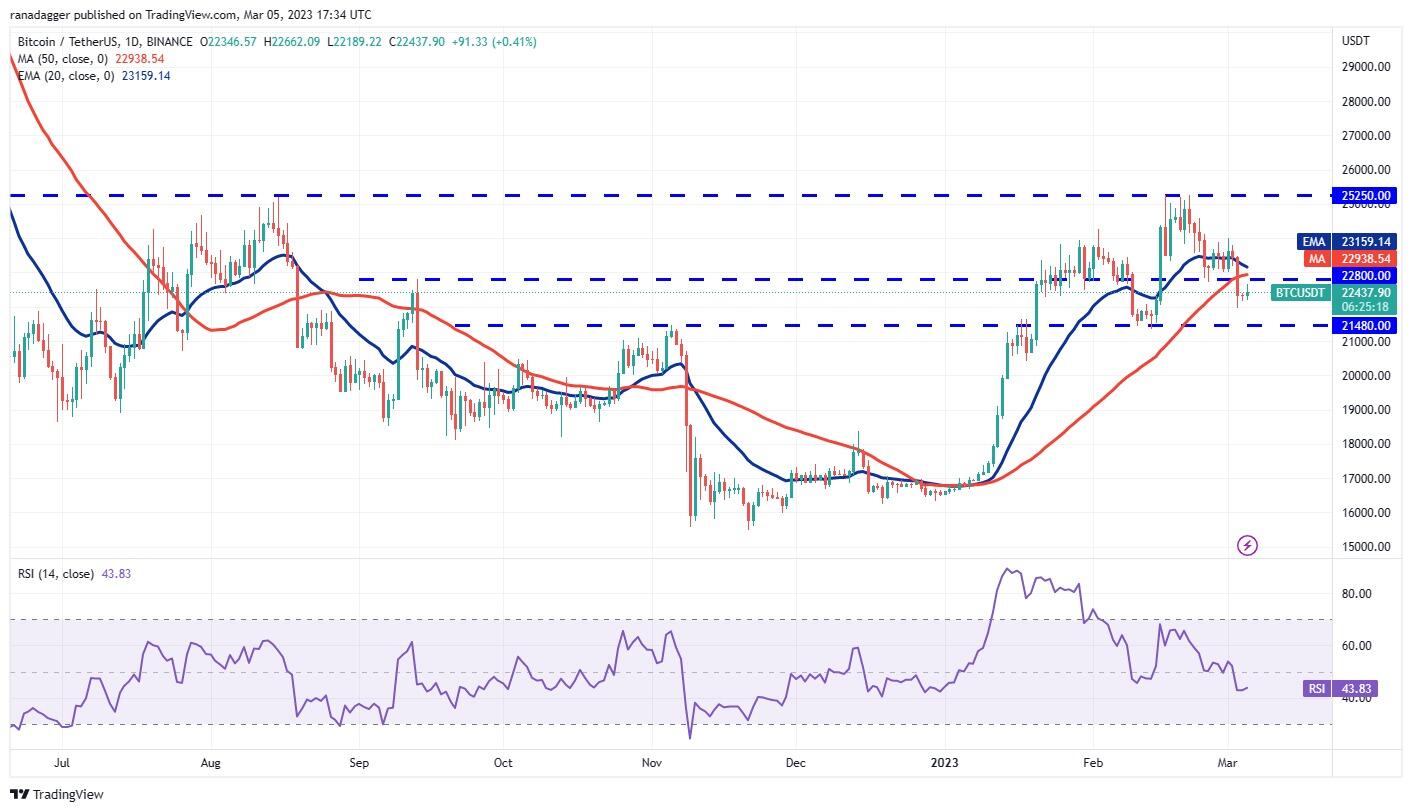
Bitcoin plummeted below the $22,800 support on March 3. Buyers tried to push the price back above the breakdown level on March 5 but the long wick on the candlestick suggests that bears are trying to flip $22,800 into resistance.
BTC/USDT daily chart. Source: TradingView
The 20-day exponential moving average ($23,159) has started to turn down and the relative strength index (RSI) is below 44, indicating that bears are trying to solidify their position. Sellers will try to sink the price below the support at $21,480. If they can pull it off, the BTC/USDT pair may retest the vital support at $20,000.
If bulls want to prevent the downside, they will have to quickly thrust the price above the 20-day EMA. Such a move will suggest aggressive buying at lower levels. The pair may then rise to $24,000 and thereafter rally to $25,250. A break above this resistance will indicate a potential trend change.
BTC/USDT 4-hour chart. Source: TradingView
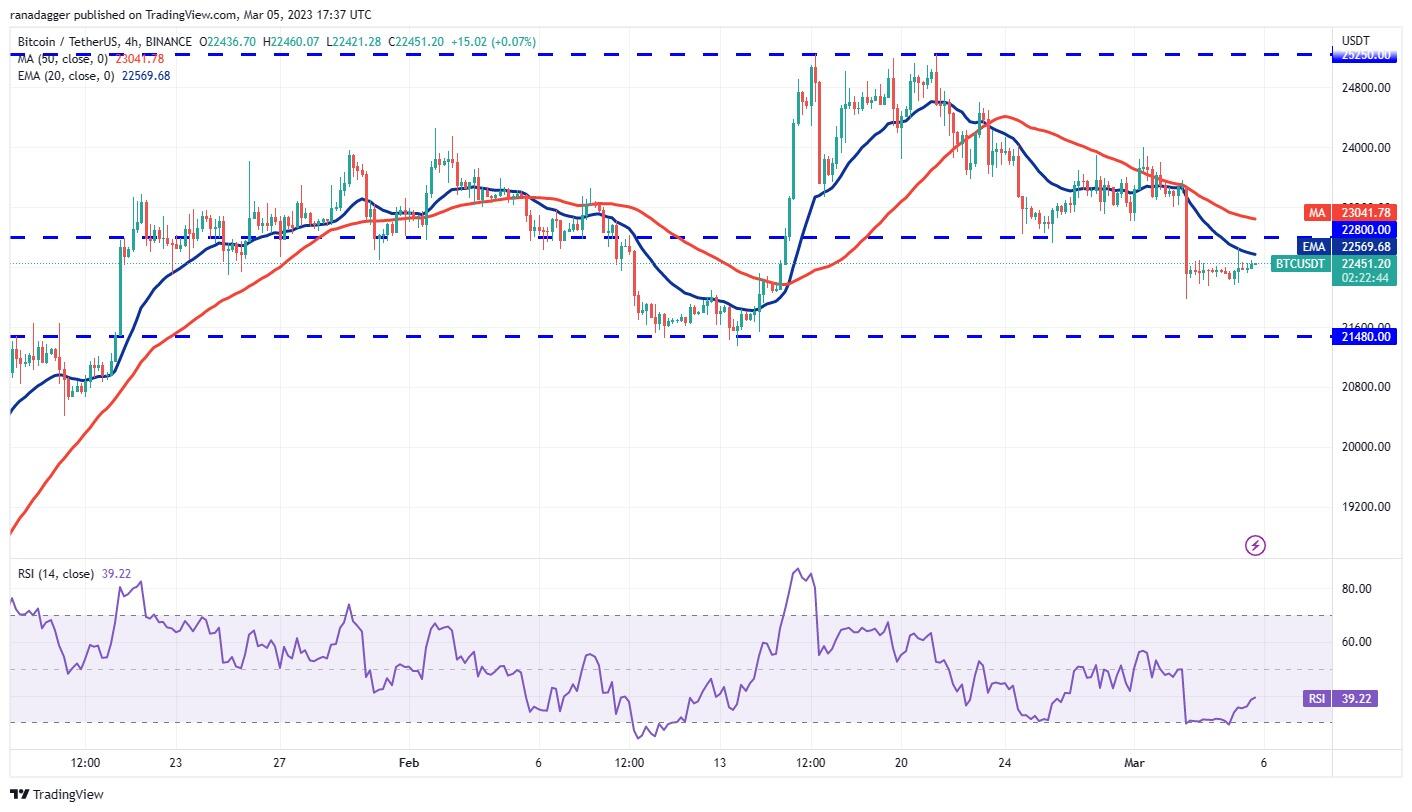
The moving averages are turning down on the 4-hour chart and the RSI is near 39. This indicates that bears have the upper hand. If the price turns down from the 20-EMA and breaks below $21,971, the pair may retest the support at $21,480.
Instead, if bulls drive the price above the 20-EMA, it will suggest that the bears may be losing their grip. The pair could then climb to the 50-simple moving average. This is an important level for the bears to defend because a break above it may open the gates for a rally to $24,000.
EOS/USDT
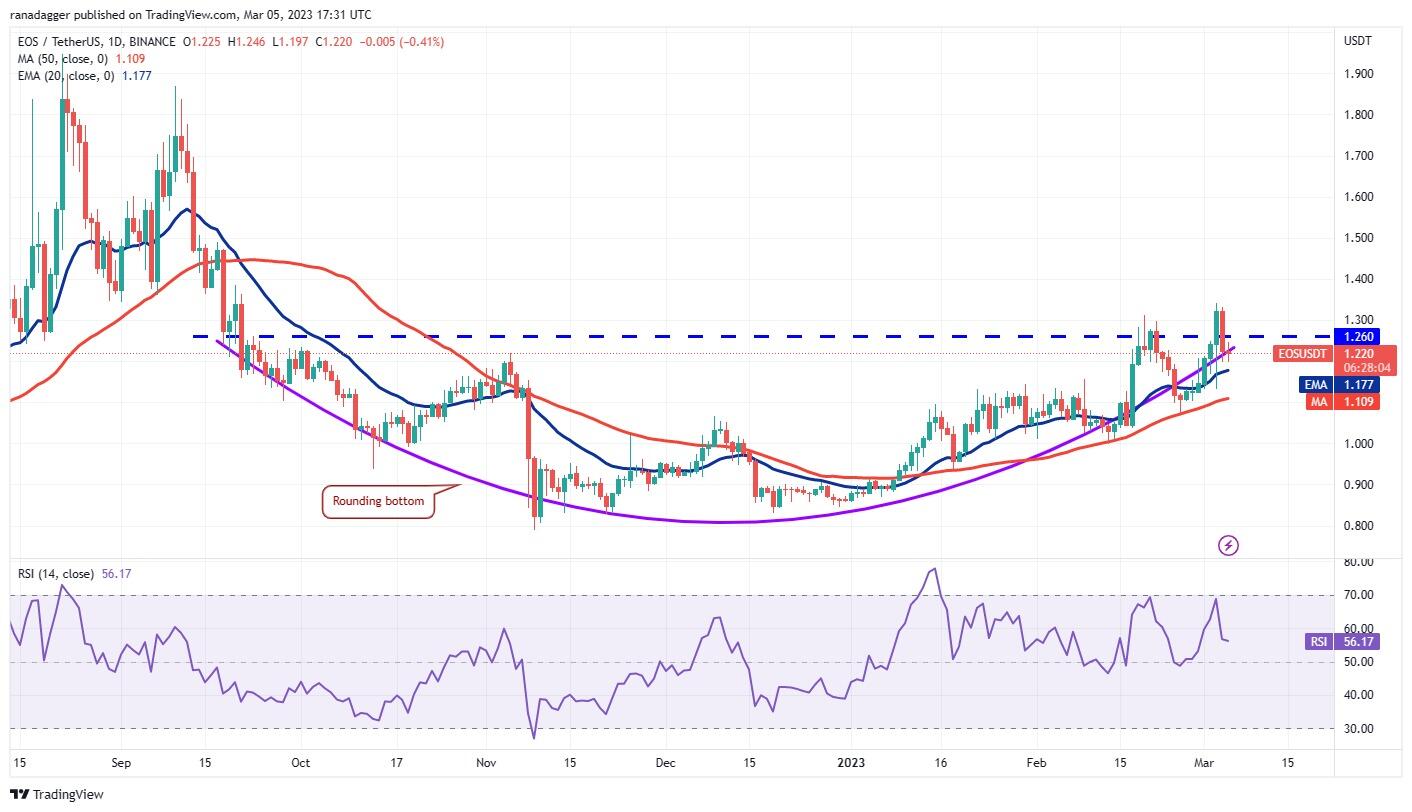
EOS broke above the vital resistance of $1.26 on March 3 but the bulls could not sustain the higher levels. However, a positive sign is that the price has not dropped below the 20-day EMA ($1.17).
EOS/USDT daily chart. Source: TradingView
The gradually upsloping moving averages and the RSI in the positive zone indicate advantage to the bulls. The EOS/USDT pair has formed a rounding bottom pattern that will complete on a break and close above the $1.26 to $1.34 resistance zone. This reversal setup has a target objective at $1.74.
The important support to watch on the downside is the 50-day SMA ($1.10). Buyers have not allowed the price to tumble below this support since Jan. 8, hence a break below it may accelerate selling. The next support on the downside is $1 and then $0.93.
EOS/USDT 4-hour chart. Source: TradingView
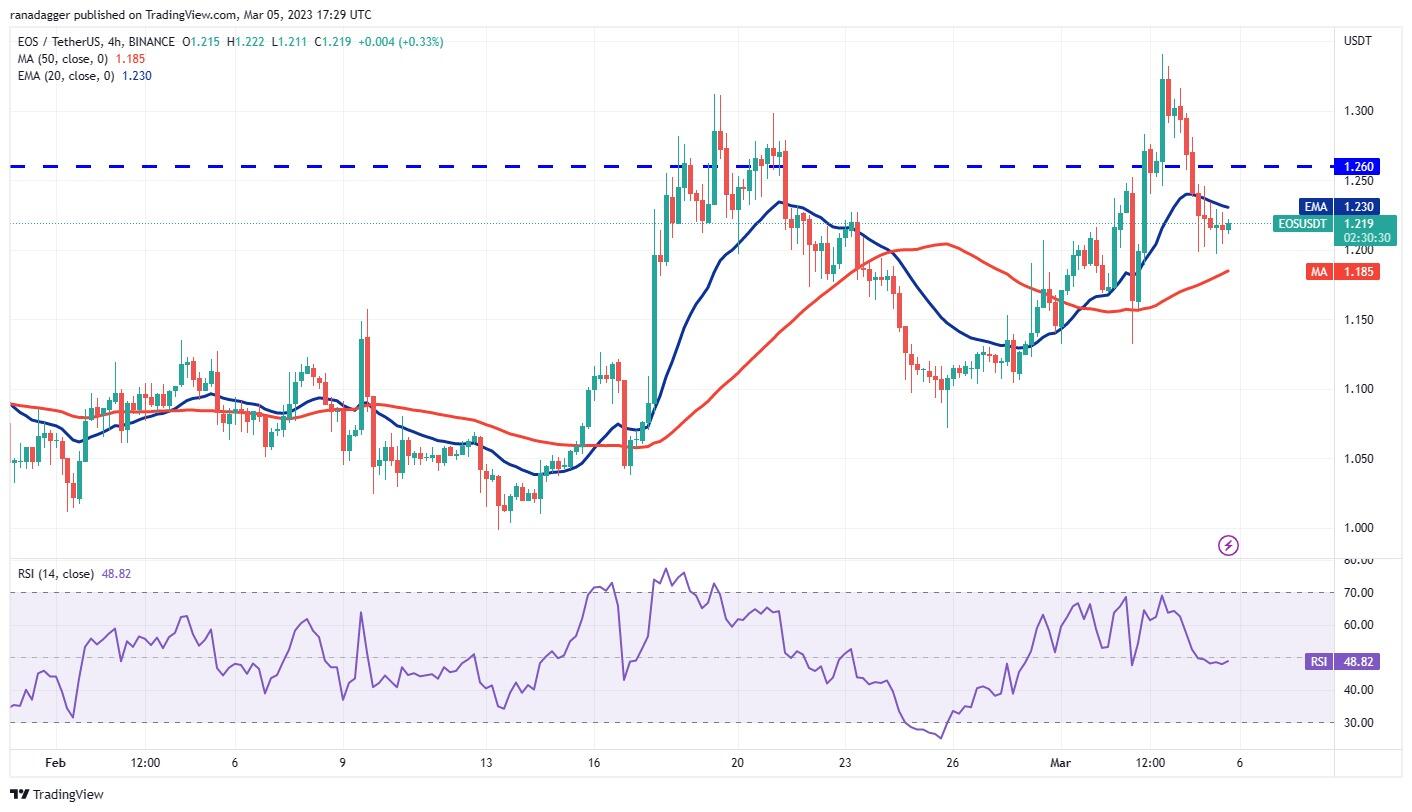
The bears pulled the price below the 20-EMA but a minor positive is that bulls have not allowed the pair to slide to the 50-SMA. This suggests that lower levels continue to attract buyers. If the price rises above the 20-EMA, the bulls will again try to clear the hurdle at $1.26. If they do that, the pair may surge to $1.34.
This positive view could invalidate in the near term if the price turns down and breaks below the 50-SMA. That may extend the fall to $1.11.
STX/USDT
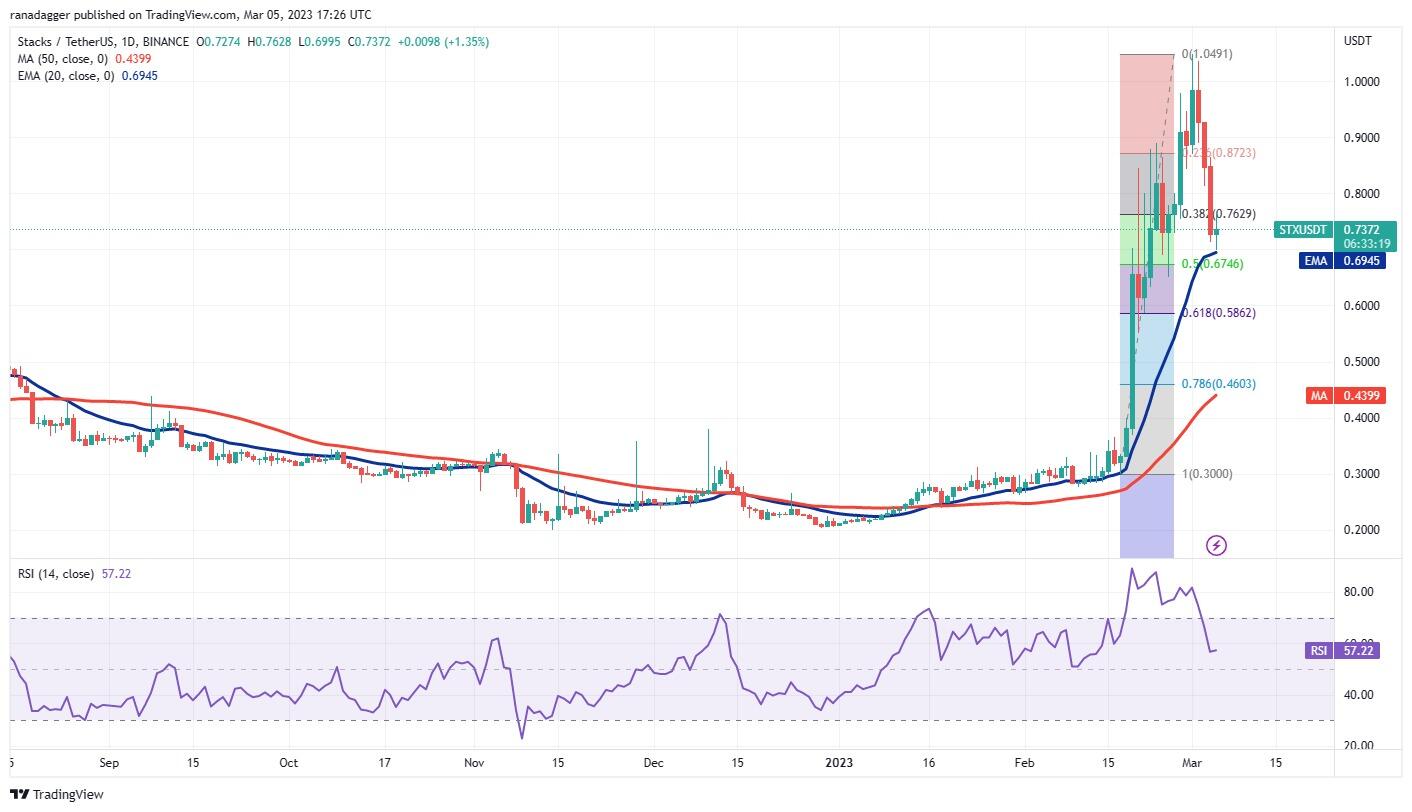
Stacks rallied sharply from $0.30 on Feb. 17 to $1.04 on March 1, a 246% rise within a short time. Typically, vertical rallies are followed by sharp declines and that is what happened.
STX/USDT daily chart. Source: TradingView
The STX/USDT pair plunged to the 20-day EMA ($0.69) where it is finding buying support. The 50% Fibonacci retracement level of $0.67 is also close by, hence the bulls will try to protect the level with vigor. On the upside, the bears will try to sell the rallies in the zone between $0.83 and $0.91.
If the price turns down from this overhead zone, the sellers will again try to deepen the correction. If the $0.67 cracks, the next support is at the 61.8% retracement level of $0.58.
Contrary to this assumption, if buyers thrust the price above $0.91, the pair may rise to $1.04. A break above this level will indicate a possible resumption of the uptrend. The pair may then rally to $1.43.
STX/USDT 4-hour chart. Source: TradingView
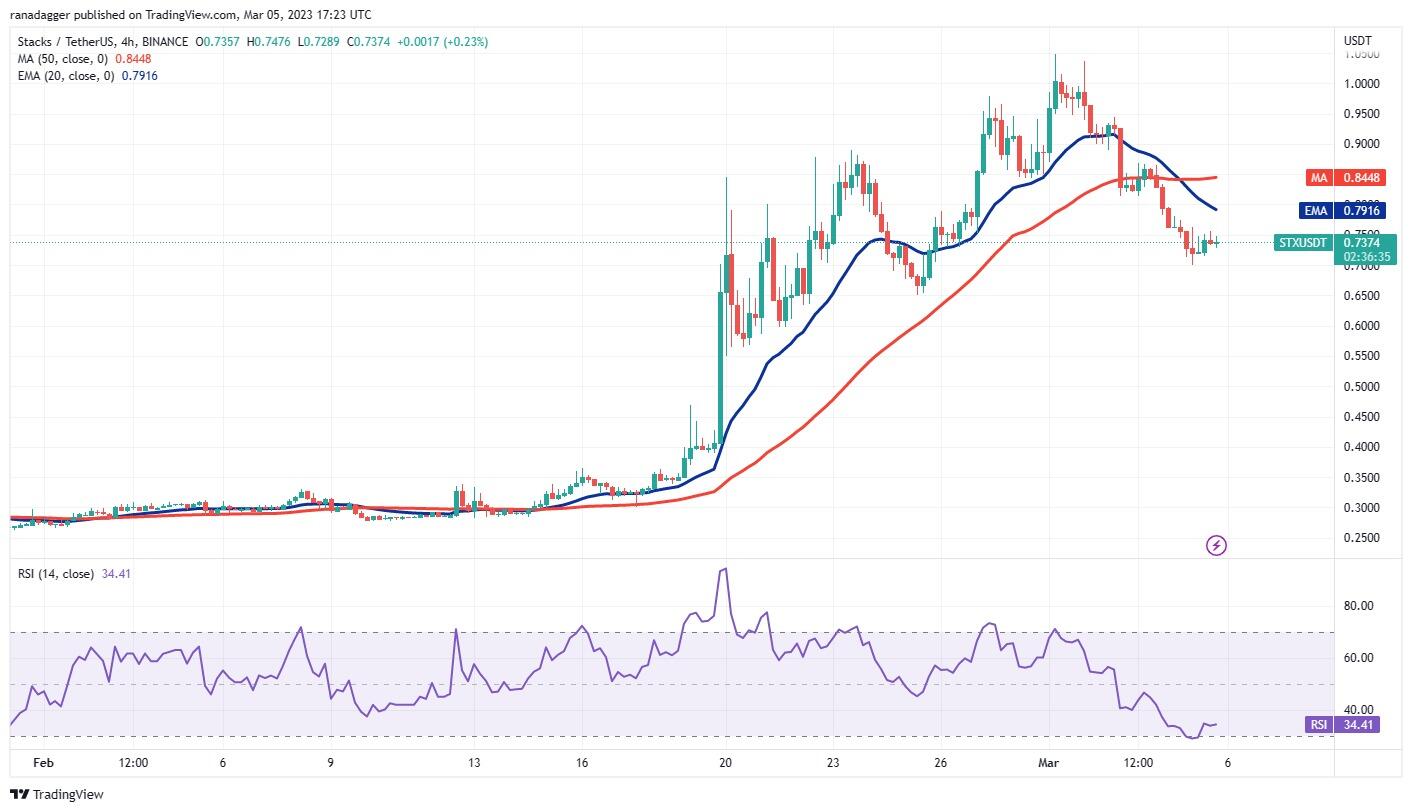
The 4-hour chart shows that the 20-EMA is sloping down and the RSI is in the negative territory, indicating that bears have a slight edge. Sellers are likely to defend the moving averages during pullbacks. They will try to maintain their hold and sink the price to $0.65 and then to $0.56. The bulls will try to fiercely defend this support zone.
The first sign of strength will be a break and close above the 50-SMA. The pair may then rise to $0.94 and later to $1.04.
IMX/USDT
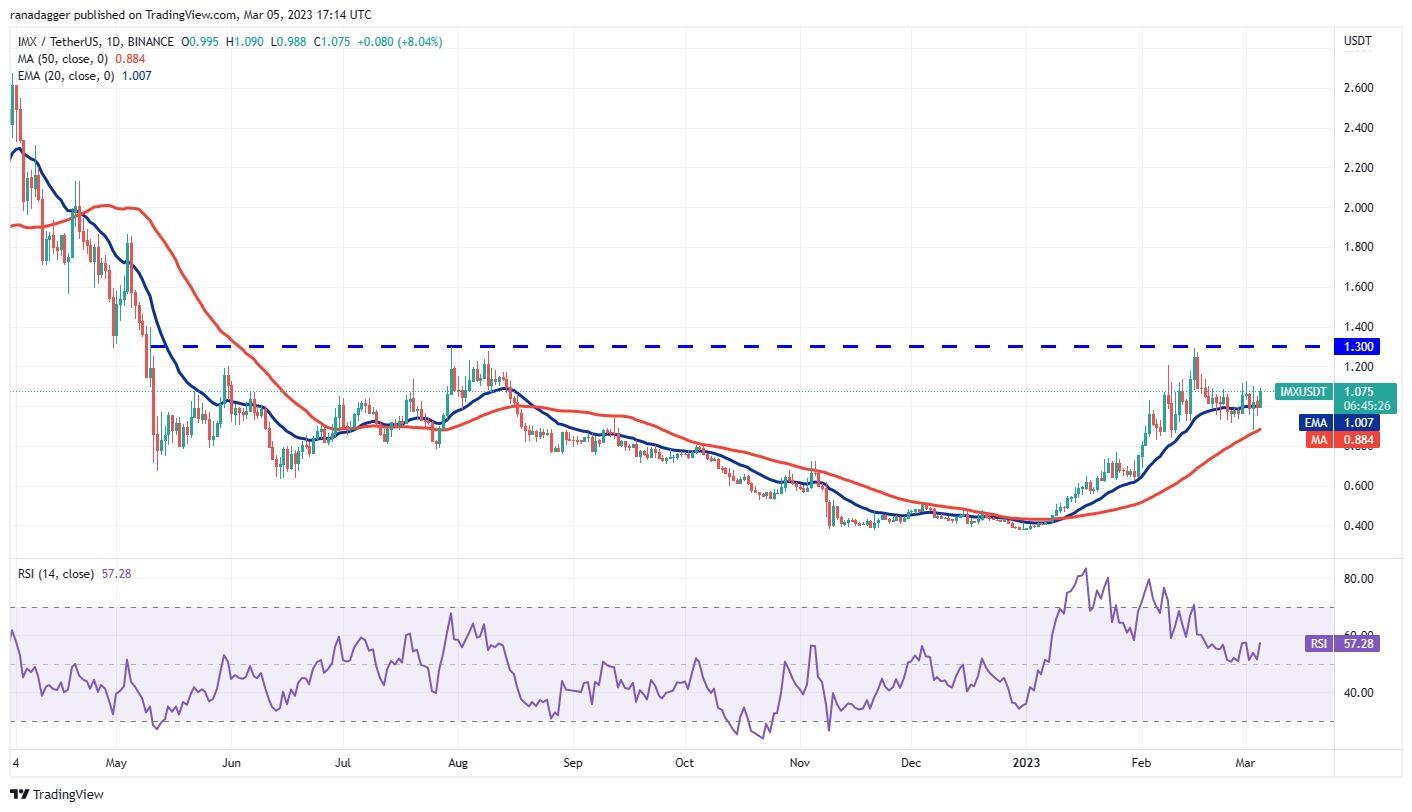
ImmutableX (IMX) rebounded off the 50-day SMA ($0.88) on March 3 and closed above the 20-day EMA ($1), indicating solid demand at lower levels.
IMX/USDT daily chart. Source: TradingView
The IMX/USDT pair could rise to $1.12 where the bears will again try to stall the recovery. If buyers bulldoze their way through, the pair could accelerate toward the stiff overhead resistance at $1.30. This is a crucial level to keep an eye on because a break and close above it may signal the start of a new uptrend. The pair may then soar to $1.85.
Contrarily, if the price turns down from the current level or $1.12, it will suggest that the bears have not yet given up. Sellers will then again try to sink the pair below the 50-day SMA and gain the upper hand. If they succeed, the pair could slump to $0.63.
IMX/USDT 4-hour chart. Source: TradingView
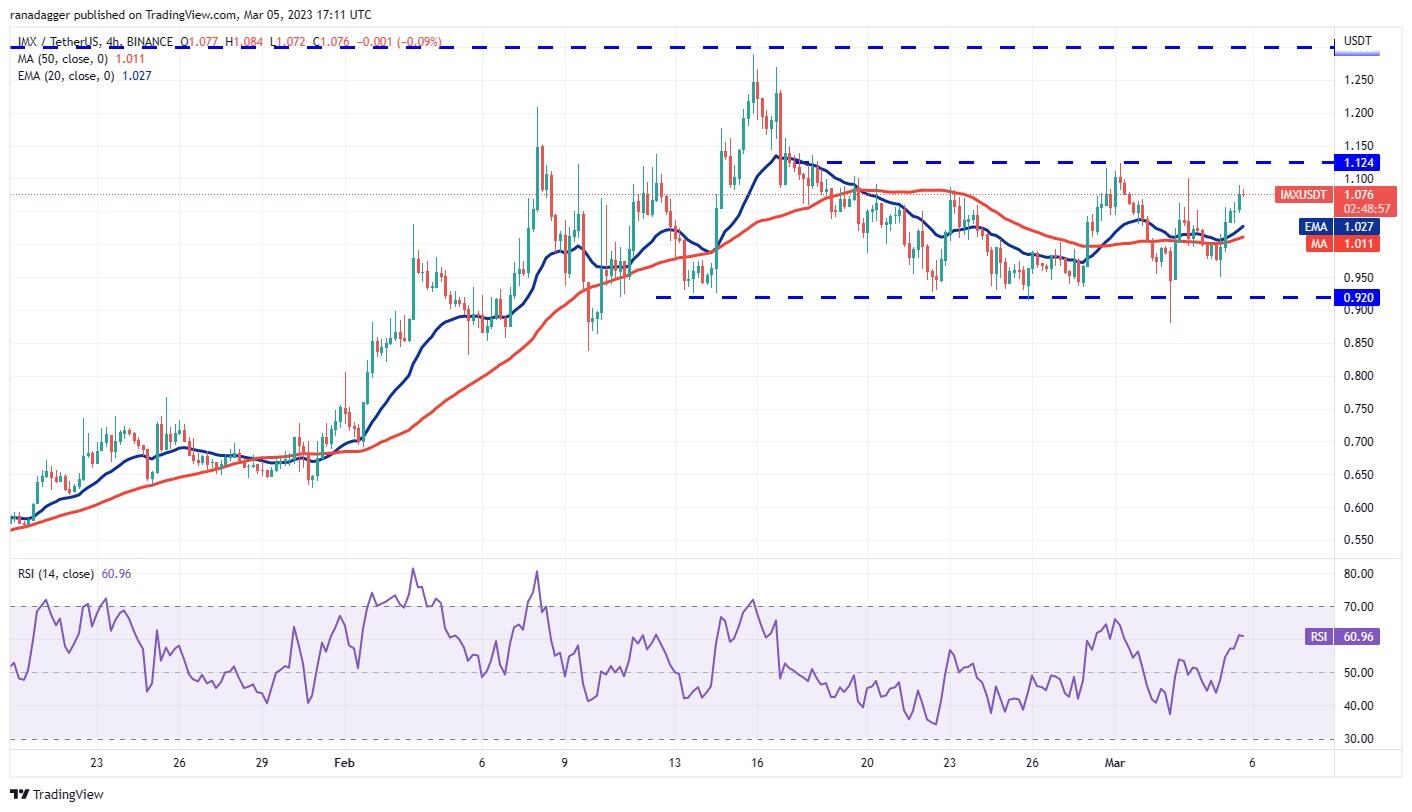
The 4-hour chart shows that the price is oscillating between $0.92 and $1.12. Usually, in a range, traders buy near the support and sell close to the resistance. The price action inside the range could be random and volatile.
If the price rises above the resistance, it suggests that the bulls have overpowered the bears. The pair may then rally toward $1.30. On the contrary, if bears sink the price below $0.92, the pair may turn negative in the near term. The support on the downside is at $0.83 and next at $0.73.
MKR/USDT
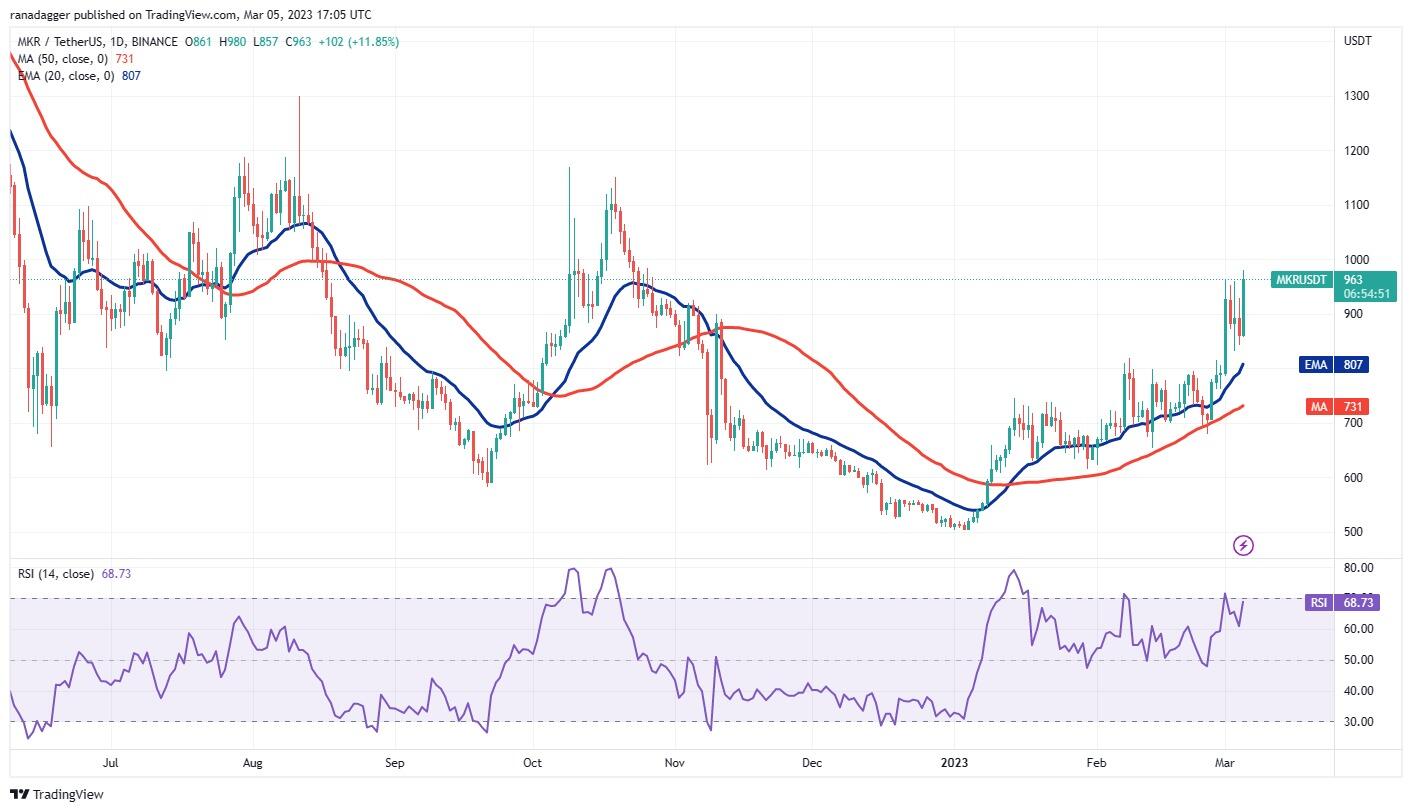
After a short-term pullback, Maker is trying to resume its up-move. This suggests that the sentiment remains positive and traders are viewing the dips as a buying opportunity.
MKR/USDT daily chart. Source: TradingView
The upsloping moving averages and the RSI in the positive territory indicate that the path of least resistance is to the upside. If buyers sustain the price above $963, the MKR/USDT pair may start its journey to the $1,150 to $1,170 resistance zone.
If bears want to stall the bullish trend, they will have to pull the price below the 20-day EMA ($807). If they manage to do that, stops of several short-term traders may be hit. The pair may then decline to the 50-day SMA ($731).
MKR/USDT 4-hour chart. Source: TradingView
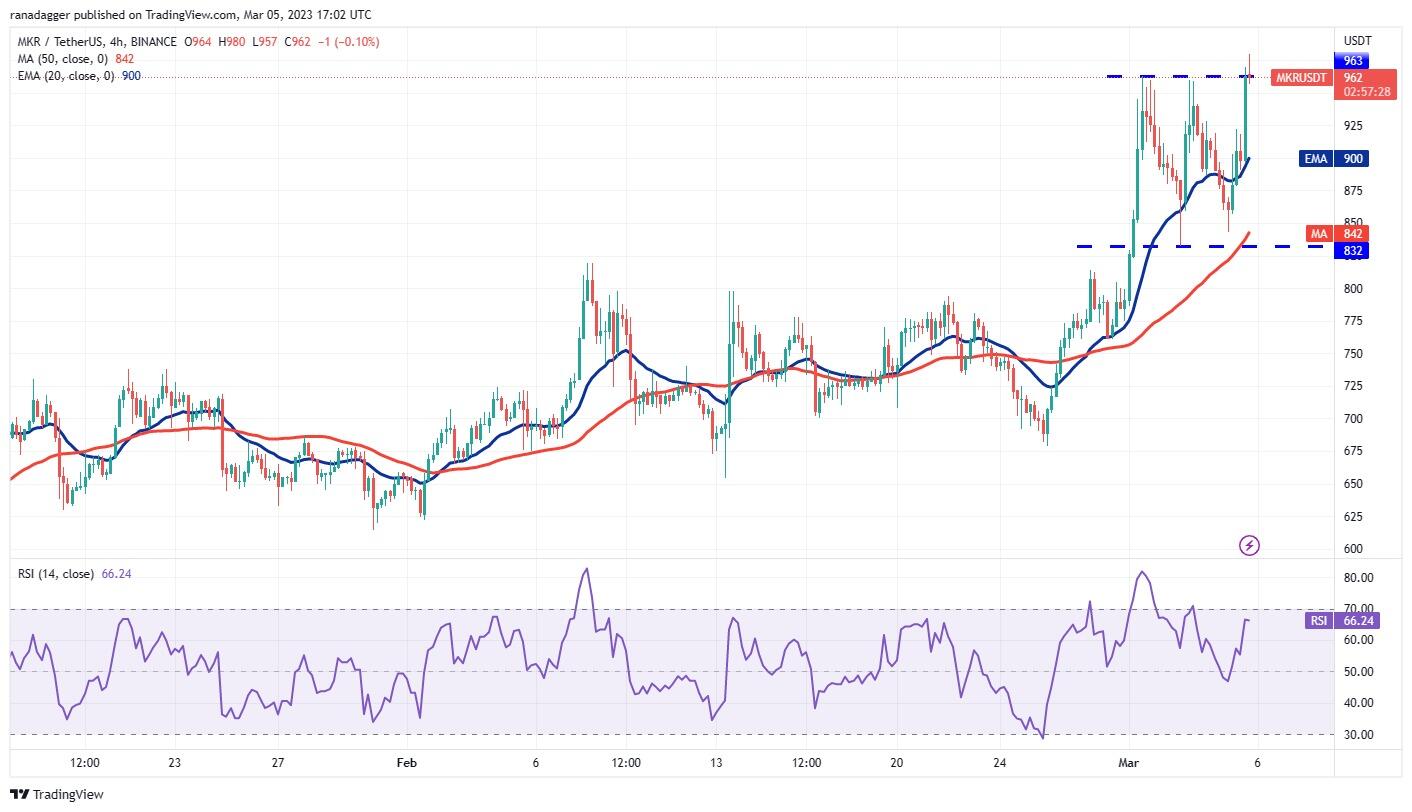
The pair had been trading between $832 and $963 for some time but the bulls are trying to kick the price above the range. The 20-EMA has turned up and the RSI is in the positive territory, indicating that bulls are in command.
If the price sustains above $963, the pair may attempt a rally to the target objective of $1,094. On the other hand, if the price turns down sharply below $963, it will suggest that the breakout may have been a bull trap. That could extend the consolidation for a while longer.
Information on these pages contains forward-looking statements that involve risks and uncertainties. Markets and instruments profiled on this page are for informational purposes only and should not in any way come across as a recommendation to buy or sell in these assets. You should do your own thorough research before making any investment decisions. FXStreet does not in any way guarantee that this information is free from mistakes, errors, or material misstatements. It also does not guarantee that this information is of a timely nature. Investing in Open Markets involves a great deal of risk, including the loss of all or a portion of your investment, as well as emotional distress. All risks, losses and costs associated with investing, including total loss of principal, are your responsibility. The views and opinions expressed in this article are those of the authors and do not necessarily reflect the official policy or position of FXStreet nor its advertisers.
Recommended Content
Editors’ Picks

Bitcoin, Ethereum and XRP steady as China slaps 125% tariff on US, weekend sell-off looming?
The Cryptocurrency market shows stability at the time of writing on Friday, with Bitcoin (BTC) holding steady at $82,584, Ethereum (ETH) at $1,569, and Ripple (XRP) maintaining its position above $2.00.

Bitcoin Weekly Forecast: Market uncertainty lingers, Trump’s 90-day tariff pause sparks modest recovery
Bitcoin price extends recovery to around $82,500 on Friday after dumping to a new year-to-date low of $74,508 to start the week. Market uncertainty remains high, leading to a massive shakeout, with total liquidations hitting $2.18 billion across crypto markets.

Bitcoin, Ethereum, Dogecoin and Cardano stabilze – Why crypto is in limbo
Bitcoin, Ethereum, Dogecoin and Cardano stabilize on Friday as crypto market capitalization steadies around $2.69 trillion. Crypto traders are recovering from the swing in token prices and the Monday bloodbath.

Can FTX’s 186,000 unstaked SOL dampen Solana price breakout hopes?
Solana price edges higher and trades at $117.31 at the time of writing on Friday, marking a 3.4% increase from the $112.80 open. The smart contracts token corrected lower the previous day, following a sharp recovery to $120 induced by US President Donald Trump’s 90-day tariff pause on Wednesday.

Bitcoin Weekly Forecast: Tariff ‘Liberation Day’ sparks liquidation in crypto market
Bitcoin (BTC) price remains under selling pressure and trades near $84,000 when writing on Friday after a rejection from a key resistance level earlier this week.

The Best brokers to trade EUR/USD
SPONSORED Discover the top brokers for trading EUR/USD in 2025. Our list features brokers with competitive spreads, fast execution, and powerful platforms. Whether you're a beginner or an expert, find the right partner to navigate the dynamic Forex market.
