- EOS price is up 15% after breaking out from above a falling wedge pattern.
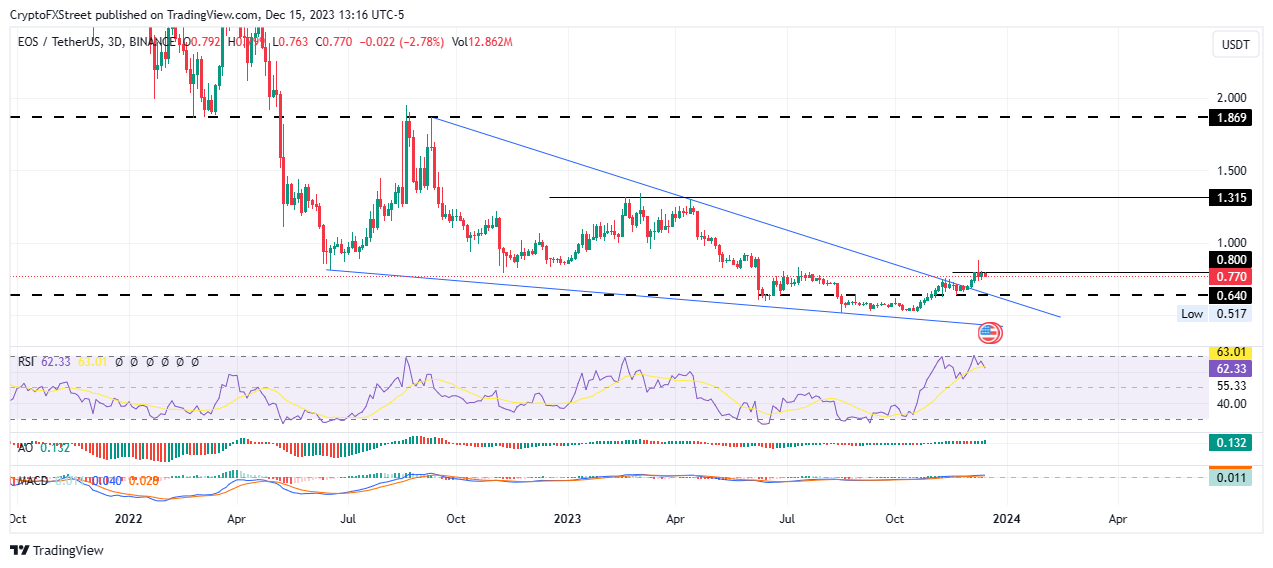
- EOS could reclaim the September 22 highs at $1.869, the target objective of the pattern, if bullish momentum rises.
- The bullish thesis will be invalidated if the price breaks and closes below the $0.640 support.
Eos (EOS) price is attempting a recovery rally after a multi-month fall, all the while consolidation below a descending trendline. Recording lower highs and lower lows, the price action culminated in a falling wedge pattern but has since vindicated itself with the potential for more gains.
Also Read: Ethereum leads altcoins north as Bitcoin halts amid bull trap fears
EOS price consolidates around $0.800, a good buying opportunity
EOS (EOS) price actions since September 2022 has resulted in the formation of a falling wedge pattern. This technical formation is a reversal chart pattern that changes the bearish trend into a bullish trend. It is formed when the price bounces between two downward-sloping, converging trendlines.
The ideal place to set a target once the price breaks above a falling wedge will be at the upper level where the falling wedge started from, with a stop loss a few pips below the final low before the breakout occurred. Setting the target objective at $1.869 in the 3-day chart for the EOS/USDT trading pair, the ongoing consolidation could be a good buying opportunity for long-term traders looking to capitalize on a possible 140% climb.
Increased buying pressure above current levels could see the EOS price extend past the $1.00 psychological level to test the 1.315 resistance level. Such a move would constitute a 70% climb above current levels.
In a highly bullish case, the gains could see EOS price flip the $1.315 roadblock into a support floor and use it as the springboard toward the $1.869 resistance level.
The position of the Relative Strength Index (RSI) above the 50 level points to strong price strength, with the green histogram bars of the Awesome Oscillator (AO) in the positive territory adding credence to the bullish outlook.
Also, the Moving Average Convergence Divergence (MACD) indicator is moving above the signal line, showing that the bulls continue to lead the EOS market.
EOS/USDT 1-day chart
On the flip side, if the $0.800 level holds as resistance, the EOS price could pull south, with the rejection likely to see the price test the $0.640 support level. A break and close below this buyer congestion zone would invalidate the prevailing bullish outlook.
Information on these pages contains forward-looking statements that involve risks and uncertainties. Markets and instruments profiled on this page are for informational purposes only and should not in any way come across as a recommendation to buy or sell in these assets. You should do your own thorough research before making any investment decisions. FXStreet does not in any way guarantee that this information is free from mistakes, errors, or material misstatements. It also does not guarantee that this information is of a timely nature. Investing in Open Markets involves a great deal of risk, including the loss of all or a portion of your investment, as well as emotional distress. All risks, losses and costs associated with investing, including total loss of principal, are your responsibility. The views and opinions expressed in this article are those of the authors and do not necessarily reflect the official policy or position of FXStreet nor its advertisers. The author will not be held responsible for information that is found at the end of links posted on this page.
If not otherwise explicitly mentioned in the body of the article, at the time of writing, the author has no position in any stock mentioned in this article and no business relationship with any company mentioned. The author has not received compensation for writing this article, other than from FXStreet.
FXStreet and the author do not provide personalized recommendations. The author makes no representations as to the accuracy, completeness, or suitability of this information. FXStreet and the author will not be liable for any errors, omissions or any losses, injuries or damages arising from this information and its display or use. Errors and omissions excepted.
The author and FXStreet are not registered investment advisors and nothing in this article is intended to be investment advice.
Recommended Content
Editors’ Picks

President Trump's memecoin leads crypto unlock with incoming supply pressure of over $320 million
Official Trump, launched by President Trump, will unlock over $320 million worth of its tokens to team members next week despite the dominant risk-off sentiment across the crypto market.

Bitcoin and crypto market sees recovery as Fed official says agency ready to stabilize market if necessary
Bitcoin rallied 5% on Friday, trading just below $84,000 following Susan Collins, head of the Boston Federal Reserve, hinting that the agency could stabilize markets with "various tools" if needed.

Bitcoin, Ethereum and XRP steady as China slaps 125% tariff on US, weekend sell-off looming?
The cryptocurrency market shows stability at the time of writing on Friday, with Bitcoin holding steady at $82,584, Ethereum at $1,569, and Ripple maintaining its position above $2.00.

Bitcoin, Ethereum, Dogecoin and Cardano stabilze – Why crypto is in limbo
Crypto traders are digesting US President Donald Trump’s Liberation Day announcements last week, the tariff truce declared on Wednesday and the worsening situation with China, as the industry wraps one of its worst weeks in terms of price swings.

Bitcoin Weekly Forecast: Market uncertainty lingers, Trump’s 90-day tariff pause sparks modest recovery
Bitcoin (BTC) price extends recovery to around $82,500 on Friday after dumping to a new year-to-date low of $74,508 to start the week. Market uncertainty remains high, leading to a massive shakeout, with total liquidations hitting $2.18 billion across crypto markets.

The Best brokers to trade EUR/USD
SPONSORED Discover the top brokers for trading EUR/USD in 2025. Our list features brokers with competitive spreads, fast execution, and powerful platforms. Whether you're a beginner or an expert, find the right partner to navigate the dynamic Forex market.