Enjin Coin Price Analysis: ENJ is one step away from plunging to $1.50
- Enjin Coin engages reverse gears extending the bearish leg from the all-time high of $3.
- The IOMAP model reveals the presence of immense overhead pressure as attention shifts south.
- Weakening technical levels confirm the bearish narrative based on the MACD indicator.
- Holding above the ascending channel’s lower boundary could avoid potentially massive declines.

Enjin Coin is in the middle of a downswing from the record high traded around. The ongoing correction has put an end to the consistent winning streak from the beginning of March. ENJ must hold within an ascending channel to avoid the possibly extensive losses.
Enjin Coin under immense risk for a downswing
The barrier at $3 cut short the majestic upswing eying highs above $3. Meanwhile, the correction seems unstoppable, mainly due to the lack of robust support zones. For now, the most crucial buyer congestion area is the ascending parallel channel’s lower edge. Bears are currently testing the ability of this area to hold. Note that if it gives in, losses will extend toward $1.5.
A comprehensive look at the Moving Average Convergence Divergence (MACD) shows Enjin Coin gravitational pull is likely to get stronger. The MACD line (blue) widens the gap below the signal line while moving toward the midline. This shows that recovery is yet to come to sight, and Enjin Coin’s least resistance path is downwards.
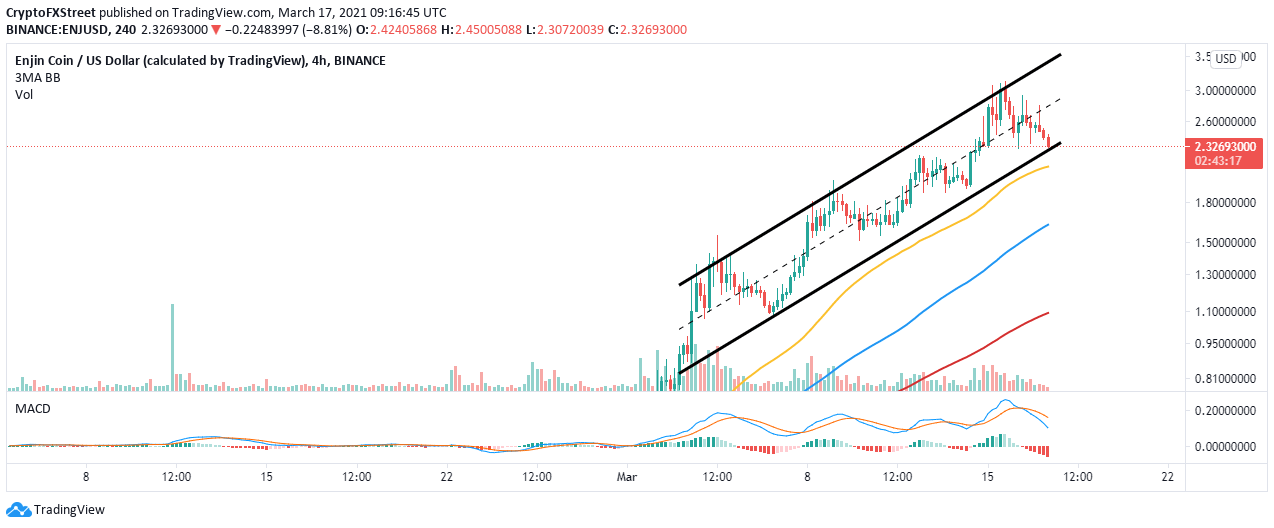
ENJ/USD 4-hour chart
The IOMAP model reinforces the bearish perspective by revealing the intense resistance head of ENJ. Recovery will not come easy based on the seller congestion between $2.42 and $2.49. Here, 47 addresses had previously bought nearly 39 million ENJ.
On the downside, the absence of robust support areas is a negative signal. The subtle anchor running from $2.21 and $2.28 is unlikely to hold for long. Note that 67 addresses had previously purchased roughly 10.7 million ENJ.
-637515718813145285.png)
Enjin Coin IOMAP model
Looking at the other side of the fence
The ascending parallel channel support must stay intact to prevent Enjin Coin from diving toward $1.5. Note that the 50 Simple Moving Average (SMA) and the 100 SMA are in line to absorb the selling pressure at $2.12 and $1.62, respectively.
On the upside, gains above the channel’s middle boundary will bolster ENJ toward the recent all-time high at $3 and perhaps renew the uptrend to another record high.
Author

John Isige
FXStreet
John Isige is a seasoned cryptocurrency journalist and markets analyst committed to delivering high-quality, actionable insights tailored to traders, investors, and crypto enthusiasts. He enjoys deep dives into emerging Web3 tren