- Elrond has been rejected from the all-time high at $220, resulting in losses under $200.
- A sell signal on the daily chart appears to have catalyzed the overhead pressure.
- The bearish outlook will be ignored if EGLD holds at the ascending parallel channel lower boundary.
Elrond has hit a resistance barrier after a whopping 800% rally since the beginning of January. The altcoin’s exponential growth ignored most of the dips in Bitcoin price encountered in the past few weeks. A new all-time high was formed at $220 before the ongoing correction took over. For now, EGLD is exchanging hands at $180 as bears return with a bang.
Update February 11: Elrond has been consolidating its previous moves and rising by around 1% to hit $178 at the time of writing. Is it a dead cat bounce after EGLD dropped from the highs of $215? A pattern of a limited advance from the lows before taking another dive. Even a dead cat bounces when falling on the floor. However, some may see the current range trading as an energy-saving phase before Elrond makes another sharp rise to the upside. Will it happen over the weekend? Lower trading volume may result in robst moves.
Update: Elrond (EGLD) has resumed its rise, recapturing the $180 level and advancing toward $183 as of Wednesday. The cryptocurrency has been holding onto most of its recent gains and stands in robust trading volume. According to CoinMarketCap, the digital coin's capitalization has surpassed $3 billion once again, placing it 24th among its peers – above the valuation of Tezos (XTZ). Is the profit-taking over? That remains an open question.
Elrond embarks on a gain-trimming exercise
The hourly chart shows that EGLD has been trading within an ascending parallel channel, guiding the bulls to new highs. However, the upper boundary remained unbroken, allowing bears to make a comeback.
At the time of writing, the 50 Simple Moving Average (SMA) support has been lost. Meanwhile, bulls are working like ants to defend the channel’s lower edge support. If this support is lost, Elrond will likely drop to the 100 SMA, currently at $150.
The Relative Strength Index has validated the bearish outlook on the hourly chart. Therefore, there is a chance the $150 support might be bypassed. Hence the 200 SMA holding at around $110 come to the bulls’ rescue.
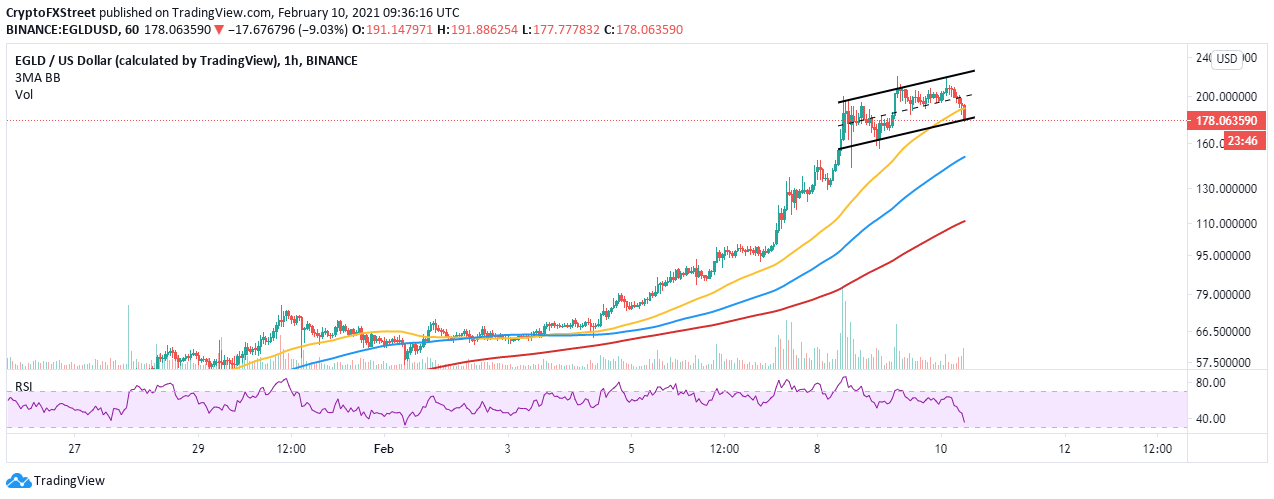
EGLD/USD 1-hour chart
The TD Sequential indicator has presented a sell signal on the daily chart, adding weight to the pessimistic outlook. If the impact of the call to sell continues, we can expect Elrond to fall further towards $100. Note that the RSI in this timeframe is overbought, hence the possibility of overhead pressure rising significantly.
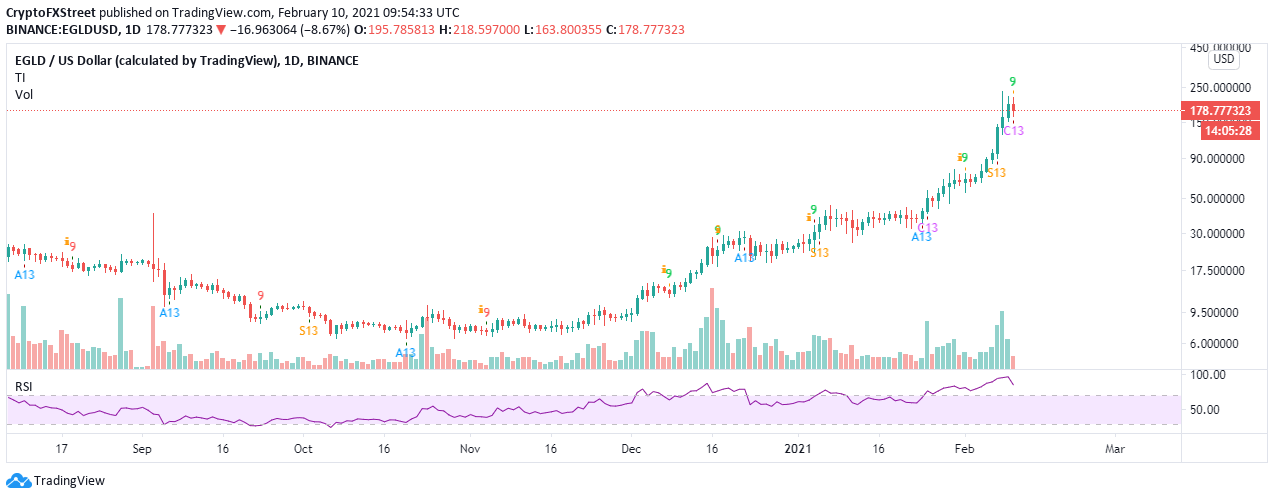
EGLD/USD daily chart
Looking at the other side of the fence
Elrond will abandon the bearish outlook altogether if the ascending channel lower boundary remains intact. A bounce from this level is likely to pull the price higher above $200. Moreover, a break above the record high at $220 will place the altcoin on another trajectory to new all-time highs targeting $300.
Information on these pages contains forward-looking statements that involve risks and uncertainties. Markets and instruments profiled on this page are for informational purposes only and should not in any way come across as a recommendation to buy or sell in these assets. You should do your own thorough research before making any investment decisions. FXStreet does not in any way guarantee that this information is free from mistakes, errors, or material misstatements. It also does not guarantee that this information is of a timely nature. Investing in Open Markets involves a great deal of risk, including the loss of all or a portion of your investment, as well as emotional distress. All risks, losses and costs associated with investing, including total loss of principal, are your responsibility. The views and opinions expressed in this article are those of the authors and do not necessarily reflect the official policy or position of FXStreet nor its advertisers. The author will not be held responsible for information that is found at the end of links posted on this page.
If not otherwise explicitly mentioned in the body of the article, at the time of writing, the author has no position in any stock mentioned in this article and no business relationship with any company mentioned. The author has not received compensation for writing this article, other than from FXStreet.
FXStreet and the author do not provide personalized recommendations. The author makes no representations as to the accuracy, completeness, or suitability of this information. FXStreet and the author will not be liable for any errors, omissions or any losses, injuries or damages arising from this information and its display or use. Errors and omissions excepted.
The author and FXStreet are not registered investment advisors and nothing in this article is intended to be investment advice.
Recommended Content
Editors’ Picks

IRS says crypto staking should be taxed in response to lawsuit
The IRS stated that rewards from cryptocurrency staking are taxable upon receipt, according to a Bloomberg report on Monday, which stated the agency rejected a legal argument that sought to delay taxation until such rewards are sold or exchanged.
Solana dominates Bitcoin, Ethereum in price performance and trading volume: Glassnode
Solana is up 6% on Monday following a Glassnode report indicating that SOL has seen more capital increase than Bitcoin and Ethereum. Despite the large gains suggesting a relatively heated market, SOL could still stretch its growth before establishing a top for the cycle.

Ethereum Price Forecast: ETH risks a decline to $3,000 as investors realize increased profits and losses
Ethereum is up 4% on Monday despite increased selling pressure across long-term and short-term holders in the past two days. If whales fail to maintain their recent buy-the-dip attitude, ETH risks a decline below $3,000.

Crypto Today: BTC hits new Trump-era low as Chainlink, HBAR and AAVE lead market recovery
The global cryptocurrency market cap shrank by $500 billion after the Federal Reserve's hawkish statements on December 17. Amid the market crash, Bitcoin price declined 7.2% last week, recording its first weekly timeframe loss since Donald Trump’s re-election.

Bitcoin: 2025 outlook brightens on expectations of US pro-crypto policy
Bitcoin price has surged more than 140% in 2024, reaching the $100K milestone in early December. The rally was driven by the launch of Bitcoin Spot ETFs in January and the reduced supply following the fourth halving event in April.

Best Forex Brokers with Low Spreads
VERIFIED Low spreads are crucial for reducing trading costs. Explore top Forex brokers offering competitive spreads and high leverage. Compare options for EUR/USD, GBP/USD, USD/JPY, and Gold.