![]() Sheldon McIntyre, CMT
Sheldon McIntyre, CMT
Independent Analyst
- Elrond price holding $130.00 on a weekly closing basis.
- Relative Strength Index (RSI) still showing EGLD is overbought.
- Key moving average has caught up with price.
Elrond (EGLD) price, taken from an intra-week analysis, crashed almost 60% in February. However, if the weekly closes are used, EGLD corrected only 15% during the month. In February, the two down weeks registered losses of just 9% and 6.9% on a closing basis. A complete contrast to the intra-week numbers and it alerts traders that potential selling pressure was exhausted in the big shakeouts during those two weeks.
Elrond price contained in a well-defined price range
When price advances almost 900% over nine weeks, there will be a significant deviation from the mean, in this case, the 10-week simple moving average (SMA). At the February high at $217.03, Elrond price was almost 300% above the 10-week SMA. By far the largest deviation from the moving average since EGLD started trading. The major decline was a reaction to the extreme condition.
Today, the 10-week SMA is only 8% below the price and now becomes a major support level for any Elrond price weakness moving forward while giving traders a good risk level for trading.
The volume trend is also complementary to the bullish narrative, as it has steadily declined over the last four weeks, affirming the interpretation that selling pressure is exhausted.
The only obstacle in front of a renewed advance is the lingering overbought condition. An ideal scenario would be for Elrond price to continue to trade sideways for a couple more weeks to release the overbought condition and then launch the breakout above $168.76.
After a daily close above $168.76, Elrond price should swiftly advance to the all-time high at $217.03, locking in a 64% gain from current trading levels. More ambitious profit targets are the 1.382 extension at $265.25 and the 1.618 extension level at $295.04.
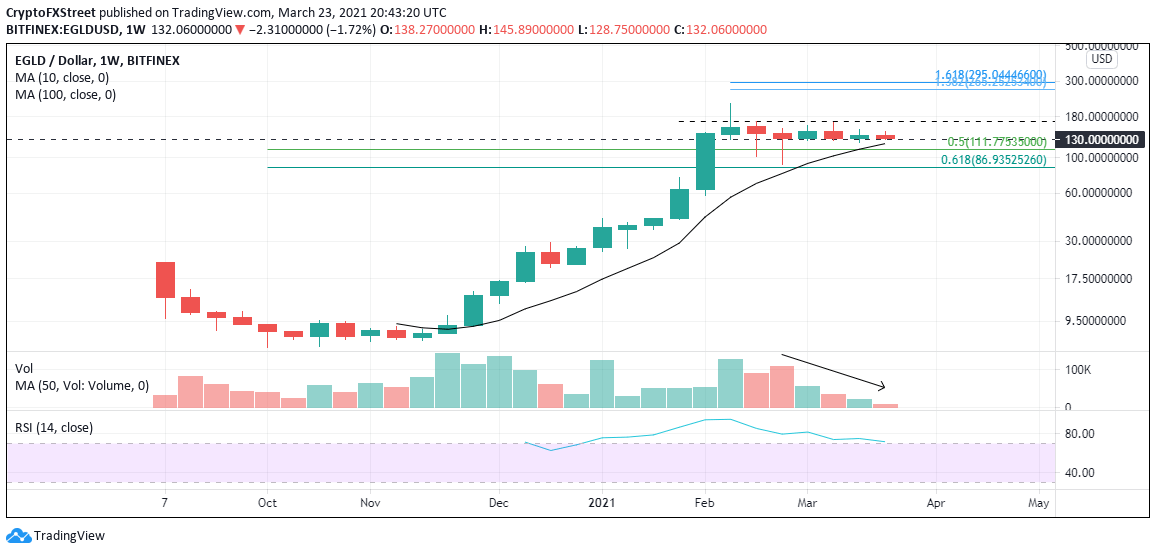
EGLD/USD weekly chart
Bears will take command on a daily close below the 0.50 retracement level of the entire gain from October 2020 at $111.77. The February low coincides with the 0.618 Fibonacci retracement level at $90.79, and it will give respite to the selling pressure.
Note: All information on this page is subject to change. The use of this website constitutes acceptance of our user agreement. Please read our privacy policy and legal disclaimer. Opinions expressed at FXstreet.com are those of the individual authors and do not necessarily represent the opinion of FXstreet.com or its management. Risk Disclosure: Trading foreign exchange on margin carries a high level of risk, and may not be suitable for all investors. The high degree of leverage can work against you as well as for you. Before deciding to invest in foreign exchange you should carefully consider your investment objectives, level of experience, and risk appetite. The possibility exists that you could sustain a loss of some or all of your initial investment and therefore you should not invest money that you cannot afford to lose. You should be aware of all the risks associated with foreign exchange trading, and seek advice from an independent financial advisor if you have any doubts.
Recommended Content
Editors’ Picks

Crypto trading volume declines further, signaling waning trader enthusiasm and market momentum
The total crypto market capitalization lost $1.01 trillion since January, while Santiment data shows that crypto-wide trading volume has dropped since February’s peak. For a healthier and more sustainable recovery, bulls look for rising prices accompanied by increasing volumes; until trading activity picks up, cautious market sentiment is likely to prevail.

BNB price tops $570 as Binance receives $2 billion investment from Dubai
BNB price rose as high as $574 on Thursday as markets reacted to news that Binance received major investments from an Abu Dhabi based firm. Derivative markets analysis shows how BNB traders are repositioning amid the latest swings in market sentiment.

PEPE price outperforming DOGE and SHIB as US CPI boosts Crypto markets
PEPE price crossed the $0.00007 for the first time this week as markets reacted to positive macro market signals. Early insights show crypto traders are displaying high risk appetite at the onset of the current market rally. Could this sustain PEPE price uptrend along with the rest of the memecoin market.

XRP records slight gains as Ripple's battle with SEC nears end
Ripple's XRP recorded a 2% gain on Wednesday following rumors of the company nearing an agreement with the Securities & Exchange Commission (SEC) to end their four-year legal battle.

Bitcoin: Will Trump's Strategic Bitcoin Reserve and White House Crypto Summit support BTC recovery?
Bitcoin price extends its decline on Friday, falling over 5% so far this week. BTC uncertainty and volatility spikes liquidated $1.67 billion as the first-ever White House Crypto Summit takes place on Friday.

The Best brokers to trade EUR/USD
SPONSORED Discover the top brokers for trading EUR/USD in 2025. Our list features brokers with competitive spreads, fast execution, and powerful platforms. Whether you're a beginner or an expert, find the right partner to navigate the dynamic Forex market.