- Elrond took out a critical profit level to the upside.
- The net port of call is $200, which has not been tested since May 12.
- Expect some sideways action between a bandwidth of 22%.
Elrond (EGLD) was on a rampage on August 30. After sellers seized control of the price action on August 20, buyers came back with a vengeance and ran the stops that sellers had placed just above the high of August 30.
Even after that, the price has been trading higher, but a little bit of cautiousness is needed as a double top looks to be forming at $185. The danger lies here that buyers will wait to add to their long, and price action could start pairing gains and turn into losses with a retest of $161 as a result.
Elrond buyers need to add some fuel to the fire to get to $200
On the other hand, a pullback would not be so bad, as long as that $161 level still gets respected and shows support. To the upside, the $200 marker is going back to May 12 and price action has not been up here for almost half a year. Expect a lot of resistance from sellers who will have this level lined up for their entries. A little bit further above, at $207 EGLD has the top from May 6 and at $210 the monthly R1 resistance level for September. Once through the $200 barrier, a few heavy hitters are lined up to keep price action muted from any further upside.
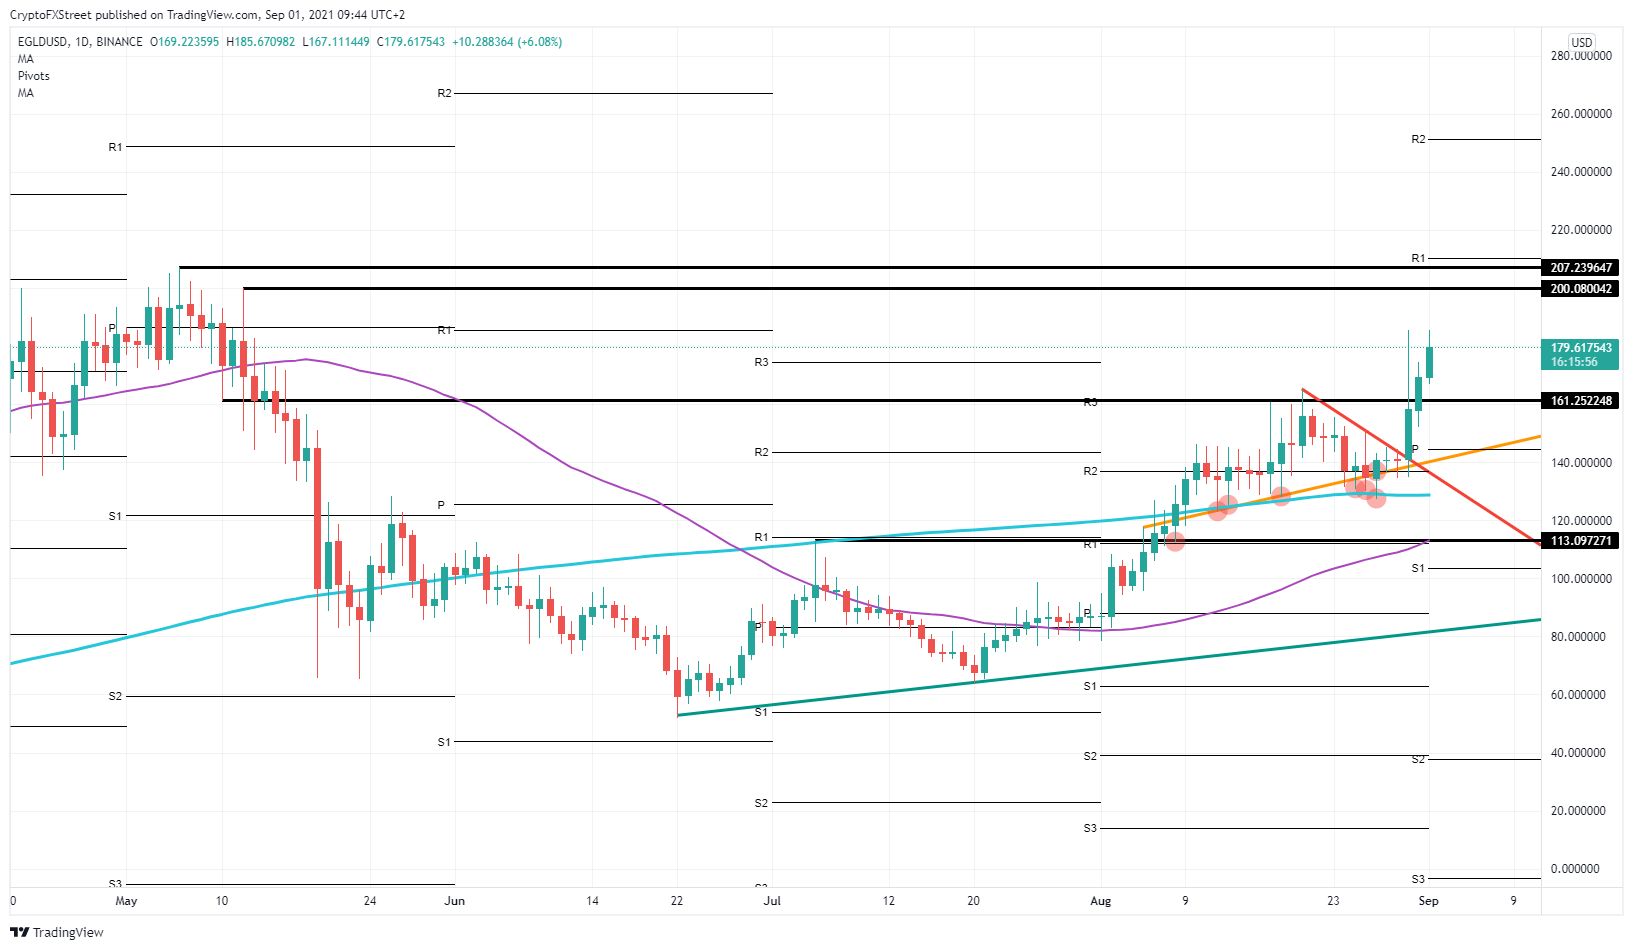
EGLD/USD daily chart
To conclude, from a buy-side perspective, either buyers step in now to run price action further up and hit that $200 level within a weekor they wait for the retreat to $161 to enter there, with probably more volume lined up and a better risk-reward.
For sellers, the message instead looks like waiting for signals on that double top formation at $185 or being patient for the $200 level to be hit. This could even be an excellent fade-in trade for shorting, between $200 and $207, with a stop tucked away above the monthly R1 resistance at $210.
Information on these pages contains forward-looking statements that involve risks and uncertainties. Markets and instruments profiled on this page are for informational purposes only and should not in any way come across as a recommendation to buy or sell in these assets. You should do your own thorough research before making any investment decisions. FXStreet does not in any way guarantee that this information is free from mistakes, errors, or material misstatements. It also does not guarantee that this information is of a timely nature. Investing in Open Markets involves a great deal of risk, including the loss of all or a portion of your investment, as well as emotional distress. All risks, losses and costs associated with investing, including total loss of principal, are your responsibility. The views and opinions expressed in this article are those of the authors and do not necessarily reflect the official policy or position of FXStreet nor its advertisers. The author will not be held responsible for information that is found at the end of links posted on this page.
If not otherwise explicitly mentioned in the body of the article, at the time of writing, the author has no position in any stock mentioned in this article and no business relationship with any company mentioned. The author has not received compensation for writing this article, other than from FXStreet.
FXStreet and the author do not provide personalized recommendations. The author makes no representations as to the accuracy, completeness, or suitability of this information. FXStreet and the author will not be liable for any errors, omissions or any losses, injuries or damages arising from this information and its display or use. Errors and omissions excepted.
The author and FXStreet are not registered investment advisors and nothing in this article is intended to be investment advice.
Recommended Content
Editors’ Picks
Ripple on-chain metrics show bullish signs amidst legal struggle with SEC, XRP eyes recovery
Ripple made a comeback above $0.48 on Tuesday and hovers above that level in Wednesday’s European session. Ripple on-chain metrics such as transaction volume and Network Realized Profit/Loss have turned bullish, supporting a recovery in the altcoin.
Bitcoin price falls amidst German government transfers, miners activity
Bitcoin (BTC) extends correction on Wednesday and hovers around $61,000 after finding resistance near the $64,000 level on Monday. Recent on-chain data indicates heightened selling activity from Bitcoin miners early in the week.
Crypto Today: Bitcoin erases gains from end of June, Ethereum declines while Ripple holds
Bitcoin wipes out gains from the last week of June and falls below $60,000 on Wednesday. Ethereum and top altcoins ranked by market capitalization erased gains as the inflation outlook worsened. Ripple holds on to recent gains and hovers above $0.48 on Wednesday.
Three reasons why altcoins could shake off losses this week
On-chain data from Santiment shows that altcoins are currently in the opportunity zone, or generating buy signals. The top three altcoins in the buy zone are Basic Attention Token (BAT), Chromia (CHR), and Highstreet (HIGH), per Santiment.
Bitcoin: BTC price correction could end in July, according to seasonal data
Bitcoin (BTC) price appears poised for a decline this week, influenced by slight outflows in US spot ETFs, selling activity among BTC miners, and a combined transfer of 4,690.28 BTC to centralized exchanges by the US and German governments.