- Elrond price consolidating above long-term moving average.
- Relative Strength Index (RSI) not overbought on the 4-hour, 12-hour, or daily charts.
- March 26 volume was the largest on a positive day since March 4.
Like the entire cryptocurrency complex, Elrond price suffered losses last week, but the 15.7% rebound on March 26 was an exclamation point on the conviction of buyers. Within two days from the low, EGLD recaptured the 50-day simple moving average (SMA) and triggered a double bottom pattern.
Elrond price measured move puts the 0.786 Fibonacci retracement level in play
EGLD has discovered disciplined support on the 50-day SMA over the three trading days after mildly reversing the double bottom breakout. It is a bullish development that fortifies it as a short consolidation of a robust rebound.
The double bottom measured move of 28.3% will carry EGLD to $191.17 from the double bottom trigger level at $149.05. The gain is just above the 0.786 Fibonacci retracement level of the February crash at $190.02.
On the path to a solid profit stands resistance at the March high at $165.00, followed by the 0.618 Fibonacci retracement level at $168.81.
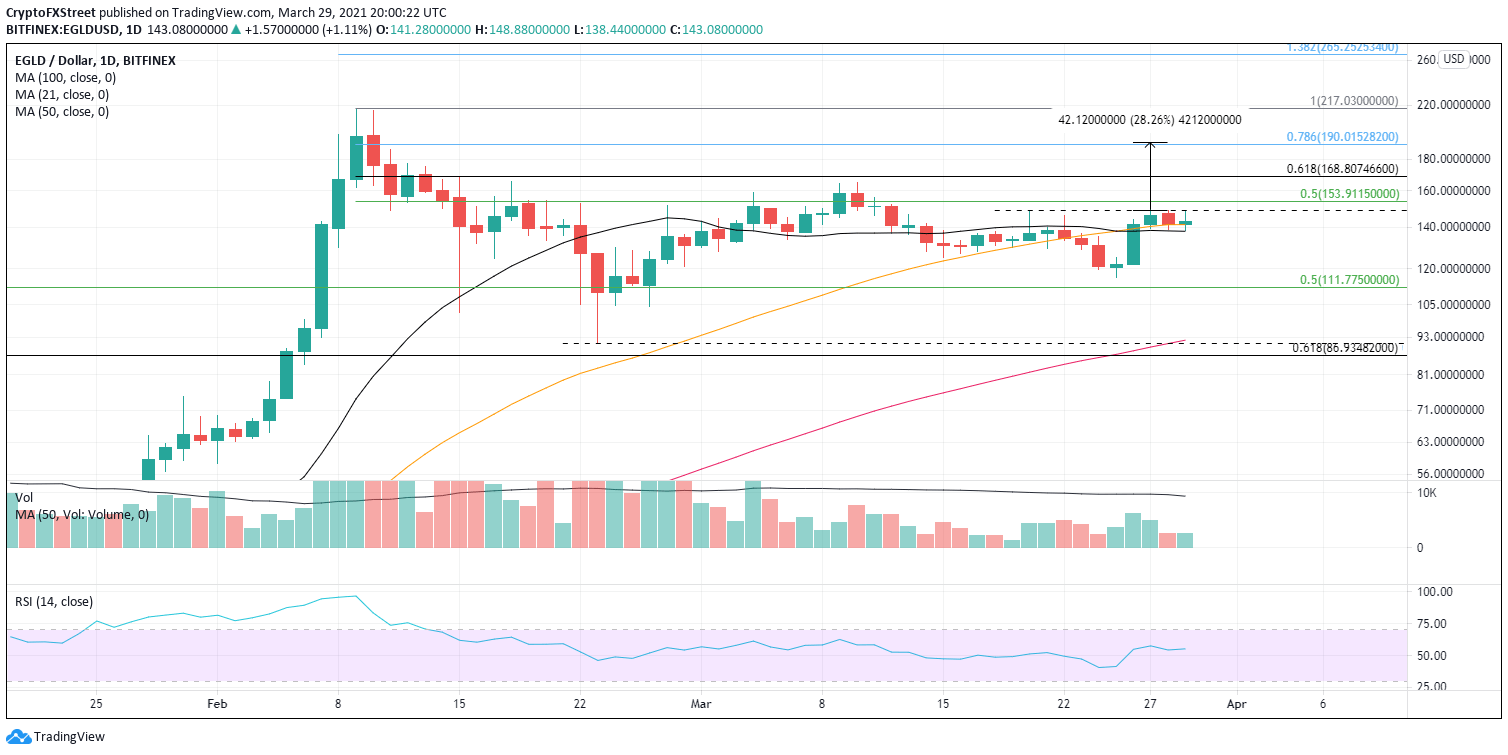
EGLD/USD daily chart
A daily close below the 21-day SMA would counter the bullish narrative and may empower the bears to retrace the bounce from the March 25 low. The downside should be limited to the 0.50 retracement level from the all-time low to the all-time high.
Note: All information on this page is subject to change. The use of this website constitutes acceptance of our user agreement. Please read our privacy policy and legal disclaimer. Opinions expressed at FXstreet.com are those of the individual authors and do not necessarily represent the opinion of FXstreet.com or its management. Risk Disclosure: Trading foreign exchange on margin carries a high level of risk, and may not be suitable for all investors. The high degree of leverage can work against you as well as for you. Before deciding to invest in foreign exchange you should carefully consider your investment objectives, level of experience, and risk appetite. The possibility exists that you could sustain a loss of some or all of your initial investment and therefore you should not invest money that you cannot afford to lose. You should be aware of all the risks associated with foreign exchange trading, and seek advice from an independent financial advisor if you have any doubts.
Recommended Content
Editors’ Picks
Ripple on-chain metrics show bullish signs amidst legal struggle with SEC, XRP eyes recovery
![Ripple on-chain metrics show bullish signs amidst legal struggle with SEC, XRP eyes recovery](https://editorial.fxstreet.com/images/Markets/Currencies/Cryptocurrencies/Coins/Ripple/Ripple_Coin_31_02_XtraSmall.jpg)
Ripple made a comeback above $0.48 on Tuesday and hovers above that level in Wednesday’s European session. Ripple on-chain metrics such as transaction volume and Network Realized Profit/Loss have turned bullish, supporting a recovery in the altcoin.
Bitcoin price falls amidst German government transfers, miners activity
![Bitcoin price falls amidst German government transfers, miners activity](https://editorial.fxstreet.com/images/Markets/Currencies/Digital%20Currencies/Bitcoin/bit-coin-symbol-flag-3d-illustration-59931110_XtraSmall.jpg)
Bitcoin (BTC) extends correction on Wednesday and hovers around $61,000 after finding resistance near the $64,000 level on Monday. Recent on-chain data indicates heightened selling activity from Bitcoin miners early in the week.
Crypto Today: Bitcoin erases gains from end of June, Ethereum declines while Ripple holds
![Crypto Today: Bitcoin erases gains from end of June, Ethereum declines while Ripple holds](https://editorial.fxstreet.com/images/Markets/Currencies/Digital%20Currencies/Bitcoin/Bitcoin_2_XtraSmall.jpg)
Bitcoin wipes out gains from the last week of June and falls below $60,000 on Wednesday. Ethereum and top altcoins ranked by market capitalization erased gains as the inflation outlook worsened. Ripple holds on to recent gains and hovers above $0.48 on Wednesday.
Three reasons why altcoins could shake off losses this week
![Three reasons why altcoins could shake off losses this week](https://editorial.fxstreet.com/images/Markets/Currencies/Cryptocurrencies/cryptos_XtraSmall.jpg)
On-chain data from Santiment shows that altcoins are currently in the opportunity zone, or generating buy signals. The top three altcoins in the buy zone are Basic Attention Token (BAT), Chromia (CHR), and Highstreet (HIGH), per Santiment.
Bitcoin: BTC price correction could end in July, according to seasonal data
![Bitcoin: BTC price correction could end in July, according to seasonal data](https://editorial.fxstreet.com/images/Markets/Currencies/Digital%20Currencies/Bitcoin/bitcoin_5_XtraSmall.jpg)
Bitcoin (BTC) price appears poised for a decline this week, influenced by slight outflows in US spot ETFs, selling activity among BTC miners, and a combined transfer of 4,690.28 BTC to centralized exchanges by the US and German governments.