Elliott Waves on BTC/USD hint at a bearish structure: Watch this level

Bitcoin has had another dip recently, losing yet more ground against bears. However, bulls keep prices firm above the March low at $43145, at least.
Should prices decline towards the said levels, the probabilities of an impulse to the downside will increase. And there is two way this impulse could unroll, based on how the structure from the support mentioned above is seen.
Bitcoin Decline to Wave (C) of Expanding Flat Probable
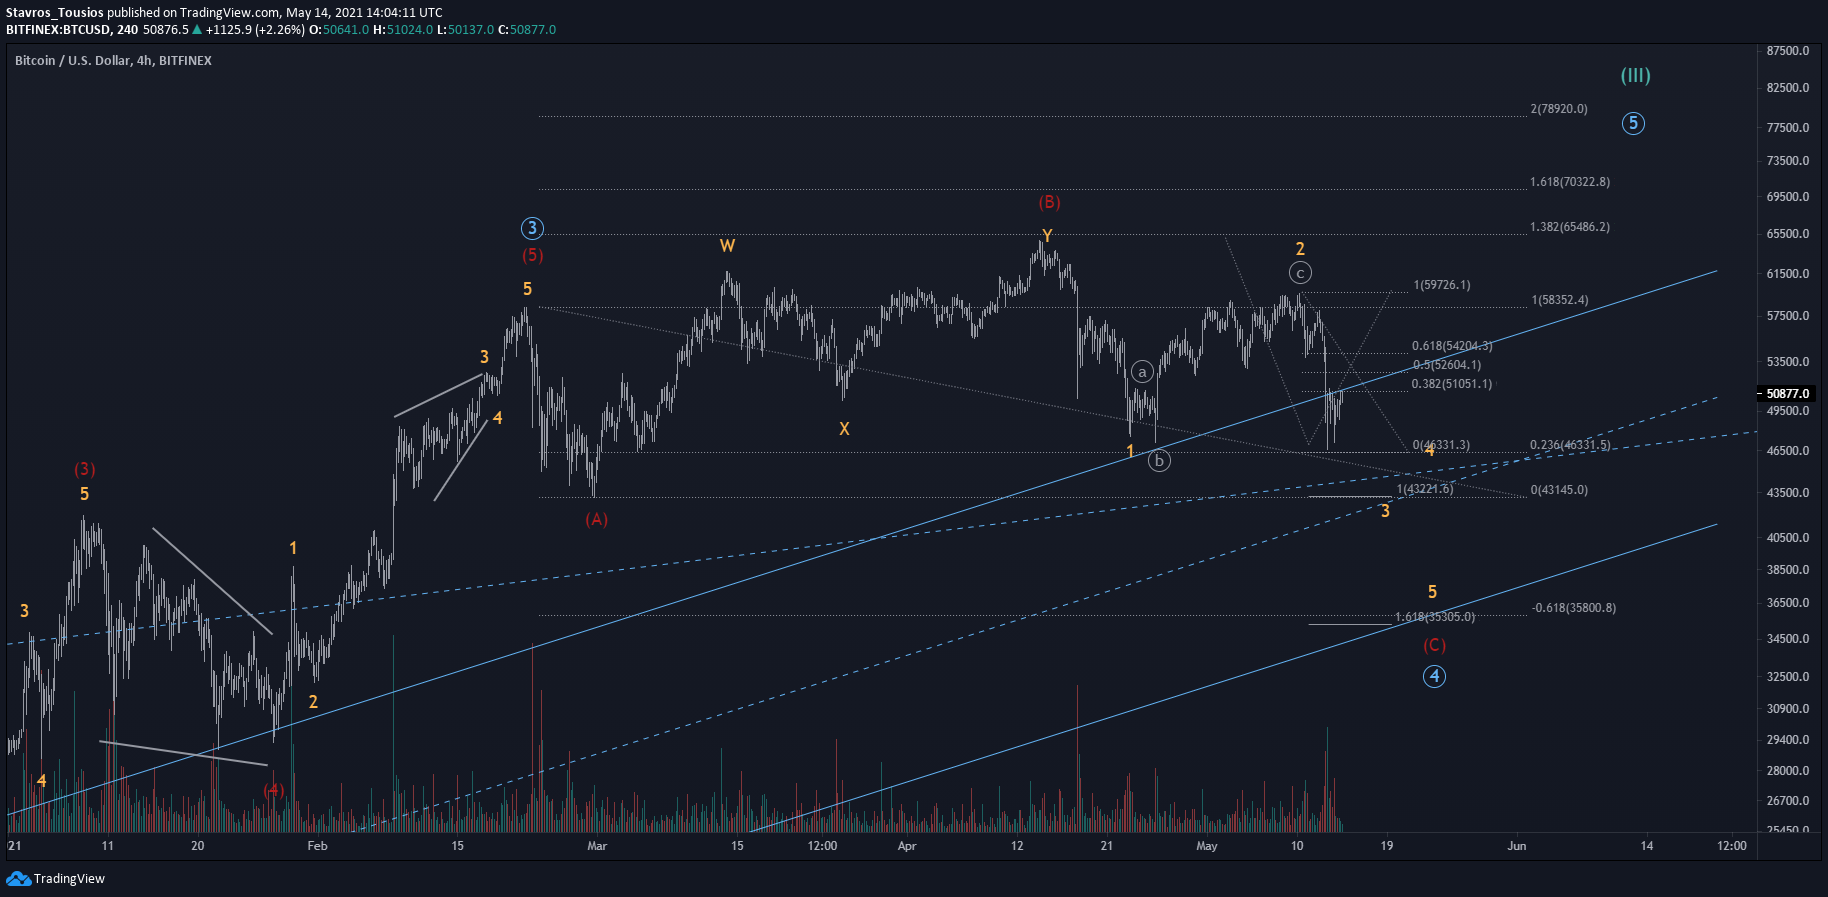
My main scenario suggests that BTCUSD could have more room to move down rather than up as long as prices remain below the 61.80% Fibonacci retracement at $54204. A break above this resistance will decrease the chances of a continuation at this stage and a further upside could be expected either for a deeper correction or a continuance in wave ⑤.
If we consider the structure as an expanding flat, wave (C) of this correction could end near the $35-36k zone. Both waves (A) and (B) respect the rules on an irregular flat, and with the downside structure having completed only 3 waves down to wave 1’s low, it’s nearly impossible that this is a running flat. Do note that running flats require 5 waves down to wave 1, but we only see 3 at this moment, pointing at another leg down, thus an expanding flat.
In addition, the expected price level for wave (C) is a cluster made of the 61.80% Fibonacci expansion of (A) and the 1.618% Fibonacci extension of waves 1 and 2.
Should the expanding flat scenario prevail, prices could bounce at the $35-36k zone and shoot higher to the ~$70k, or perhaps even extend to the ~$79k.
Alternative BTC Scenario Suggests Even Deeper Correction
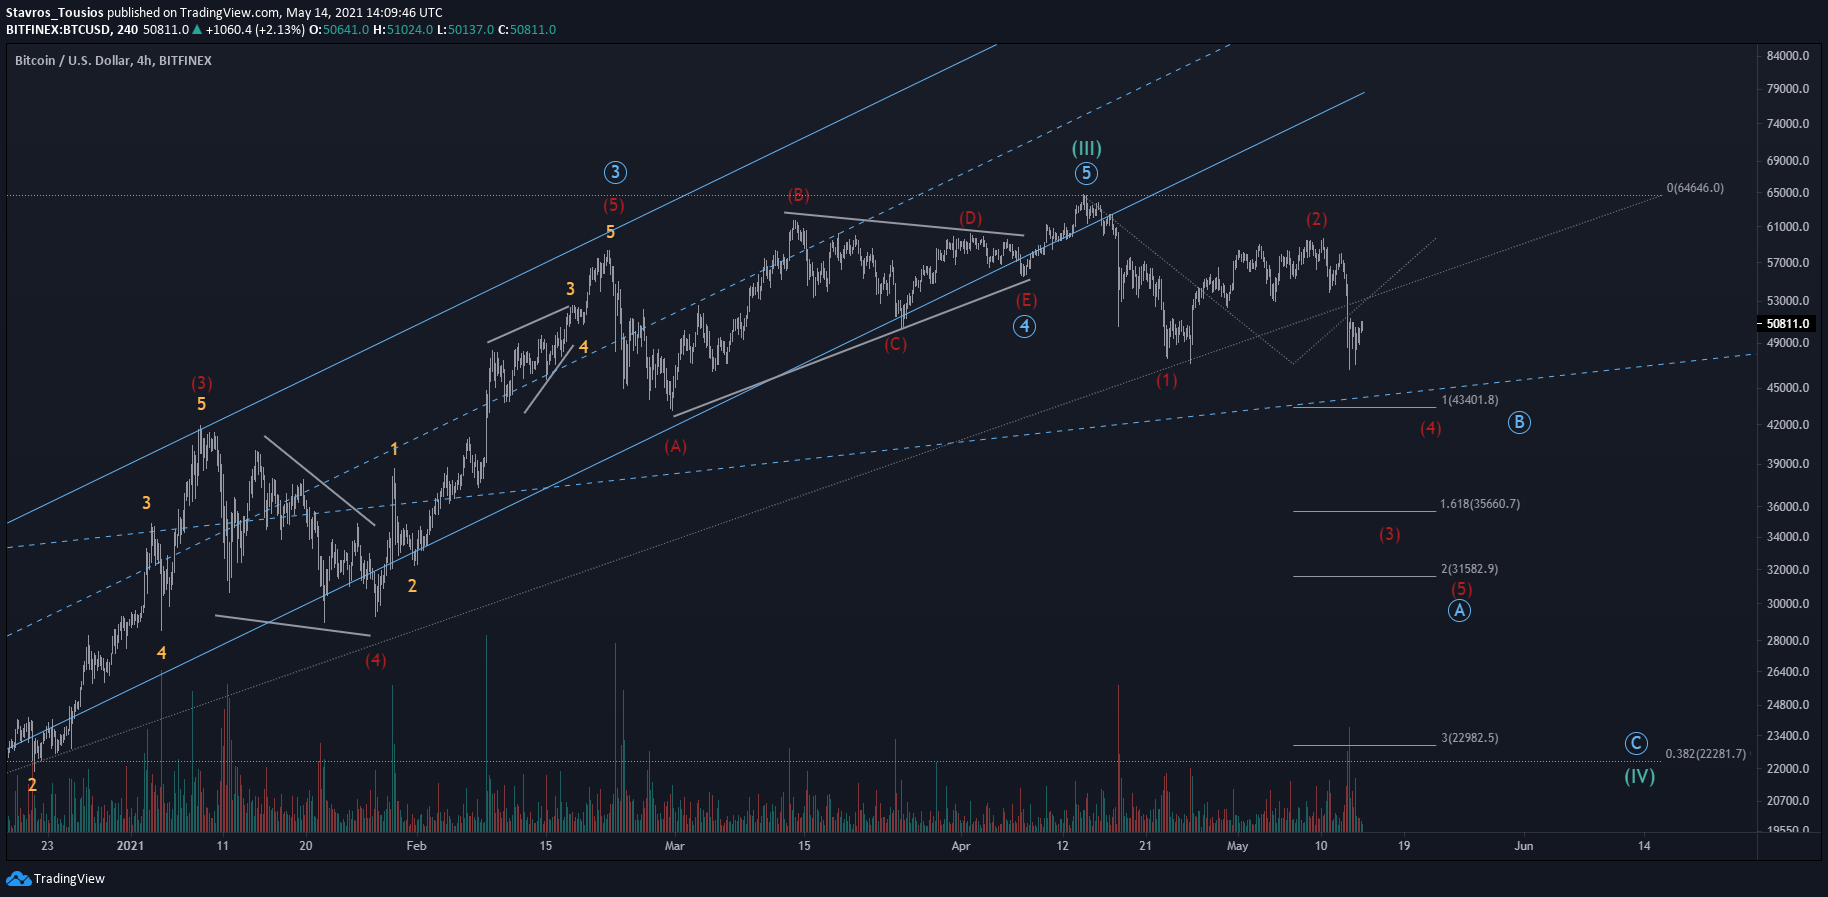
My alternative scenario indicates that cycle wave III completed at $64646 as the structure from the low of $43145 is seen as a triangle, followed by a 5-wave impulse in wave ⑤ of III.
Although the medium-term looks similar to the main scenario, the longer-term path for BTCUSD looks more bearish in that case. This would be the case should a further decline takes a 5-wave structure as wave (IV) would be expected to complete with an Ⓐ-Ⓑ-ⓒ zigzag. However, there are good probabilities that the zigzag turns into a Ⓦ-Ⓧ-Ⓨ zigzag instead.
The target for wave (5) in the alternative scenario could reach the $31582 support, with the target for wave (5) of ⓒ eying a low of $22982 as this is the 3.0% Fibonacci extension of waves (1) and (2); assumes wave ⓒ is 50% of wave Ⓐ. Near this level, there lays the 38.2% Fibonacci retracement of wave (III), making the support an attractive zone for bulls.
What Are The Chances of An Early Upside?
As expressed above, if the $54204 breaks, the chances of a continuation down will decrease, naturally. Although this alone does not constitute a signal for invalidation, it would suggest that a (W)-(X)-(Y) could be in play in wave ④.
Therefore, only a break of the local high at $59726 can support bulls further. Otherwise, we could consolidate here for a while.
Author

Stavros Tousios
Independent Analyst
Stavros is leading the Investment Research Team at a reputable Forex broker. He has been involved in the financial markets since 2014 and in cryptocurrencies trading since 2017.


